Beautiful Data Visualization and Information Design
Turn your data into a compelling story. From infographics to interactive websites, we make data visualization fast and affordable.
GET A QUOTEGive your data a voice
Doing awesome research and discovering insightful data is just the first part of your job. The next step is to use data visualization to turn your numbers into something that impresses and influences people. Visual content (like an infographic) is processed 60,000 times faster than text.1
So whether you’re publishing a research study, putting together an investment deck, or angling for a viral blog post, a little information design can go a long way. 72% of marketers agree, saying visual content is more effective than text.2 Further, turning your data into an image-based data visualization is likely to yield twice the social sharing and 12 times as much if you use video.3
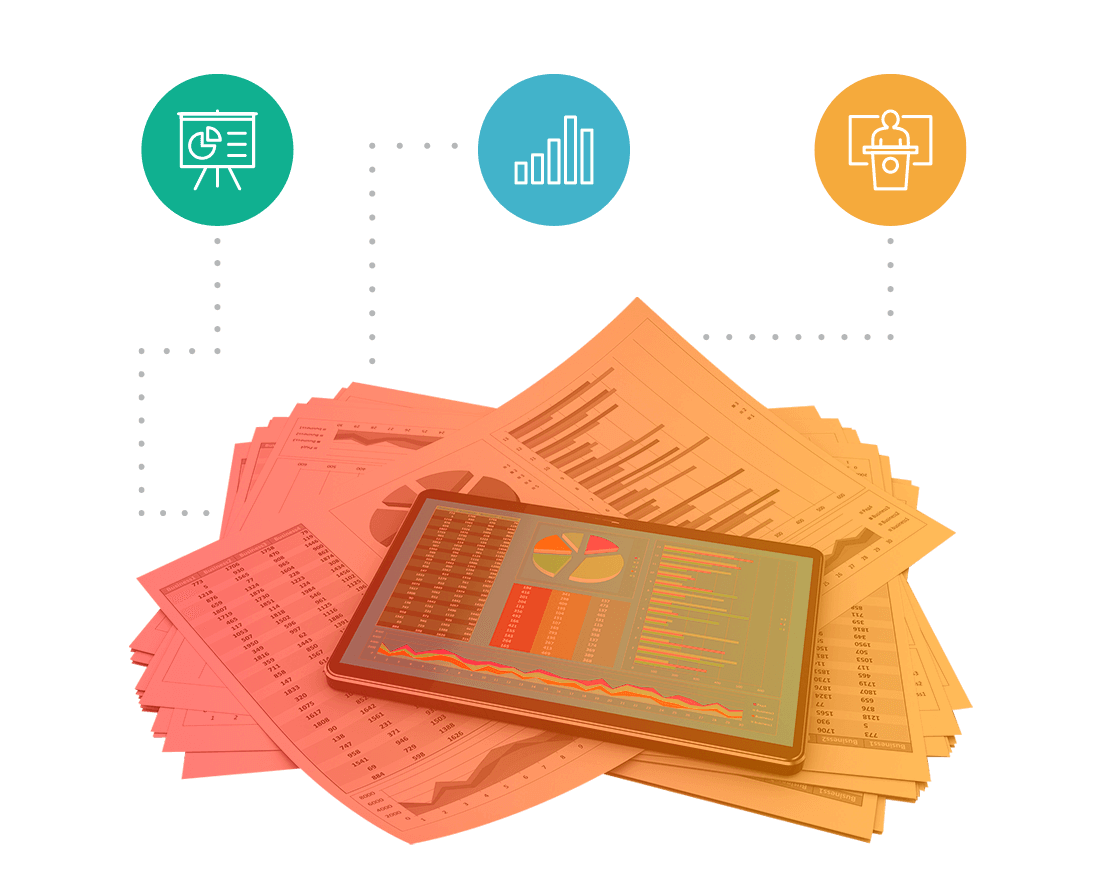
How we make your information matter
TOP TALENT
To create beautiful data visualizations, we start by handpicking a pool of 1000 of the world’s best data journalists, designers, and developers. We’re always ready to match you with the perfect team for your information design project.FAST COLLABORATION
Go from brief to finished product faster than you expect. Our powerful collaboration platform streamlines the design process, puts you in close communication with your creative team, and delivers your data visualization in record time.COST EFFECTIVE
We’re the most efficient way to turn your data into a design that gets noticed. Whether you’re working with big data, market research, or financial numbers, you’ll get high-impact content--and you’ll be able to do more with your budget.
OUR PRODUCTS
Information design that shines
Find better ways to visualize your data
From online surveys to beefed-up analytics, we’re able to gather and analyze more data than ever before. But how do you turn your findings from a dense spreadsheet into something that really makes your point? Good information design is the key.
We know the power of data visualization, and we’re dedicated to helping you do a better job of communicating the insights you’ve developed. Get started with articles and resources about data visualization and information design. Whether you want to understand different chart types or get tips for an effective slideshow, we’ve got in-depth information to help you reach your goals. And if you need a hand turning data into design, we can pair you with some of the world’s best information designers. To learn more, contact us.
CREATE DATA VISUALIZATIONS
- Infographics
- Presentations & Slideshares
- Photography
- Interactive Websites
- Cheat Sheets & One Pagers
- Videos
- eBooks
- Explainer Videos
RESOURCES FOR DATA-BASED STORYTELLING
- How to create compelling eBooks
- Creative confessions: Get the best from your creative team (video)
- The art and science of visual content (video)
- The keys to effective sales collateral
THE DATA VIZ BASICS
- Area Charts
- Bar Charts
- Business Intelligence Tools
- Choropleth Maps
- Column Charts
- Common Chart Types
- Coxcomb Chart
- Create Interactive Infographics
- Create Motion Graphics
- Create the Best Explainer Videos
- Creating Infographics: The Basics
- Data Visualization Software
- Data Visualization Tools
- Donut Charts
- Freelance Graphic Designer
- Graphic Design
- Heat Maps
- Hiring an Infographic Designer?
- Histograms
- History of Data Visualization
- History of Infographics
- Infographic Design
- Infographics Software
- Isopleth Maps
- Line Charts
- Pie Charts
- Pin Maps
- Scatter Plots & Regression Lines
- Time Series Visualizations
- Timelines
- Treemaps
- What are infographics?
- What are Interactive Infographics?
- What are Motion Graphics?
- What is Data Visualization?
- Word Clouds
