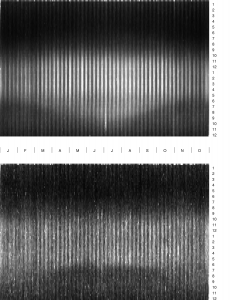
More complex heat maps can display more complex data, including data that has a spatial component, but all heat maps use color to communicate relationships between data values that would be harder to grasp in a table with numbers alone.
Heat maps have been used since the 1950s. Early heat maps were used by scientists; for instance, in biology heat maps can be used to represent genes.
More recently, heat maps have been used to display the areas of a web page that are most frequently scanned by a viewer.

More recently, heat maps have been used to display the areas of a web page that are most frequently scanned by a viewer.