Tennessee State Health Report
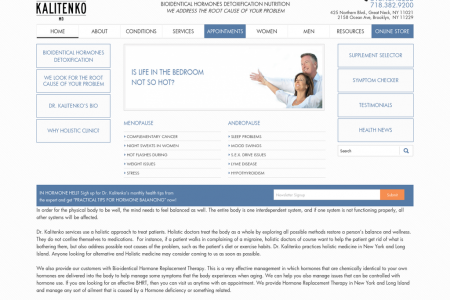
TENNESSEE STATE HEALTH REPORT HOW MUCH DOES THE STATE PAY IN TOTAL FOR HEALTHCARE? I 2013 I 2018 Hospital Physicians Prescriptions Health Ins Nursing Homes Other Pers Care Dental $56.9 B $75.9 B Home Health Gov. Public Health 2013 2018 Other Prof Tennessee as a State is expected to spend more than $57B on Healthcare in 2013. Overall expenditures are expected Other DME DME to grow 33.5% from 2013 to 2018. Goverment 10 15 20 25 30 Billion PEOPLE VERSUS GOVERMENT, WHO PAYS FOR WHAT Tennesseans are expected to spend approximately $ 10B out of pocket on Medical Expenditures. $3,990 $1,770 $2,219 HEALTH EXPENDITURES MEDICAL CARE INSURANCE COSTS Tennesseans, on average, This includes $1,770 per person for Medical Care and $2,219 for Insurance Costs. $3,990 out for Health Expenditures. pocket TOP 5 HOSPITALS BY MARKET SHARE 8% 6% 5.4% 4.1% 3.5% 4% 3.5% 3.4% 2% Methodist Jackson- Johnson City Baptist Memorial Healthcare Madison Medical Memorial Healthcare Country General Memphis Center Hospital System, Inc Hospitals Hospital DISSATISFIED WITH HOSPITAL SERVICE VERY WEAK WEAK AVERAGE STRONG VERY STRONG Baseline Year Most Recent Data Year TYPE OF CARE Very Weak Weak Average Strong Very Strong Açute Care Chronic Care Prevention Safety SETTING OF CARE Ambulatory Home Health-Hospice Nursing Home Hospital ACCESS T O CARE Structural Açcess Utilization Patient Centeredness THE UNINSURED 19% WILL WORK TENNESSEE UNINSURED RATE FOR INSURANCE 36,250 Tennesseans have signed up as of December 31, 2013. OBAMA CARE GRAYING OF TENNESSEE I2010 2013 I 2018 500k 400k 300k 200k 100k 35-39 10-14 5-9 85+ 80-84 COUNTY HEALTH RANKINGS 50/50 OUTCOMES AND FACTORS Mortality (length of life -50%) HEALTH OUTCOMES 50% Morbidity (quality of life -50%) Health Behaviour (30%) (tobacco use, diet and exercise, alcohol use, sexual activity) PROGRAMS AND POLICIES Clinical Care (20%) (access to care, quality to care) HEALTH FACTORS 50% Social & Economic Factors (40%) (education, employment, income, family and social support, community safety) Physical Environment (10%) (environmental equality, build environmental) RANKINGS SHELBY DAVIDSON RUTHERFORD SUMNER WILLIAMSON Overall TN #53 #13 #2 #3 #1 Rank (1 to 95) Health 53 13 Outcomes Health 67 28 Factors Mortality 56 19 2 Morbidity 50 11 Health Behaviors 62 3 8 Clinical Care 14 16 20 22 Social & Economics 85 67 Physical Environment 13 94 75 43 11 Smoking 19% 18% 19% 21% 4% Obesity 34% 30% 30% 30% 24% Binge Drinking 14% 12% 8% 11% 14% MONTGOMERY KNOX HAMILTON SULLIVAN WASHINGTON Overall TN #11 #14 #28 #43 #21 Rank (1 to 95) Health 11 14 28 43 21 Outcomes Health 32 2 13 4 Factors Mortality 10 16 33 12 Morbidity 19 25 56 61 44 Health 83 54 13 Behaviors Clinical Care 43 2 4 Social & 12 31 14 8 Economics Physical 87 62 46 33 Environment Smoking 28% 19% 19% 25% 26% Obesity 33% 31% 30% 35% 29% Binge Drinking 16% 10% 11% 7% HEALTH STATUS FAIR TO POOR Binge Drinking Lack of Health Insurance Disparity in Health Status High School Graduation Immunization Children Pertussis Infeçtious Disease Primary Care Physicians Air Pollution Salmonella Public Health Funding Poor Mental Health Day Chlamydia Children in Poverty Immunization Adolescents Drug Deaths Occupational Fatalities Dentists Diabetes Low Birthweight Physical Inactivity Preventable Hospitalizations Infant Mortality Cardiovascular Deaths Cançer Deaths Premature Deaths Poor Physical Health Day Obesity Violent Crime Smoking HEALTH SERVICE DEMAND I West Tennessee I Middle Tennessee I East Tennessee Tennessee Rate of Usage Per Population 4.0 3.0 2.0 1.0 0.0 Inpatient Visits Outpatient Emergency Physician Office Visits Visits Room Visits HOSPITALIZATIONS IIII----| 12%I Babies II| 9% I Lungs 8% Cardiology 8% Orthopedic 4% Psychiatry Infectious Diseases US DEATHS - HEART AND CANCER Source: National Center for Health Statistics 2013 (2010 Data) 24.2% 23.2% 2,468,435 TOTAL DEATH 597,689 574,743 CANCER HEART DISEASE THE 15 LEADING CAUSES OF DEATH IN 2010 WERE Diseases of Malignant Neoplasms (cancer) Chronic Lower Cerebrovascul Accidents ar Diseases (stroke) Heart (heart Respiratory Diseases (unintentional injuries) disease) Nephritis, Nephrotic Syndrome and Nephrosis (kidney disease) Alzheimer's Diabetes Influenza and Intentional Disease Mellitus Pneumonia Self-harm (diabetes) (suicide) Septicemia Chronic Liver Essential Parkinson's Pneumonitis Hypertension and Hypertensive Renal Disease (hypertension) Disease and Cirrhosis Disease (due to solids and liquids) LIFESTYLES NASCAR SET EMERGENCY 99 LIFESTYLE SMOKING VIOLENT PHYSICAL OBESITY DIABETES HYPER- CRIME INACTIVITY TENSION SHIFT FROM COMMERCIAL INSURANCE TO EXCHANGES/GOVERNMENT SUBSIDIZED HEALTHCARE Medi- care COMMERCIALLY INSURED 29.7% to 26.3% Working Person 37% to 38% Medicaid Medicare Obama Care 20% to 19% Medicaid 6.4% to 4.70% 0% to 4.5% Self Obama Care 2013 TENNESSEE STATE HEALTH REPORT 75-79 70-74 65-69 60-64 55-49 40-44 30-34 25-29 20-24 15-19 20-24 15-19
Tennessee State Health Report

Source
http://www.milkwhale.comCategory
HealthGet a Quote
You may also like...