Filter By :
All
Infographic
Video
Interactive
Presentation
House Democrats' Health Plan Flow Chart
29K
15
18
Red State, Blue State
17K
22
10
TV Mentions for Barack Obama and Mitt Romney from 4/25 to 5/1
2K
2
1
Left vs. Right
4K
4
Red State/Blue State: Carbon Dioxide Emissions
141
Visually Comparing May 2012 DNC and RNC Twitter Conversations
968
Local Government Chronicle (LGC) – Spheres of Influence
President Camacho Trading Card
183
The Road to Victory
597
Republican Voters Super Tuesday infographic
402
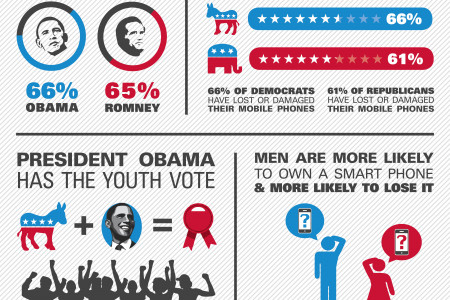
Why #areyoubetteroff GOP Hashtag #failed: US Politics Vs. Gadgets
817
The Rising Price of American Democracy
462
HISTORY OF POLITICAL PARTIES IN U.S.
1K
Election 2012: House and Senate Races to Watch
254
2010 Midterm Elections
144
2016: An Election of Surprises
14