The Revenue of the US's Biggest Brands
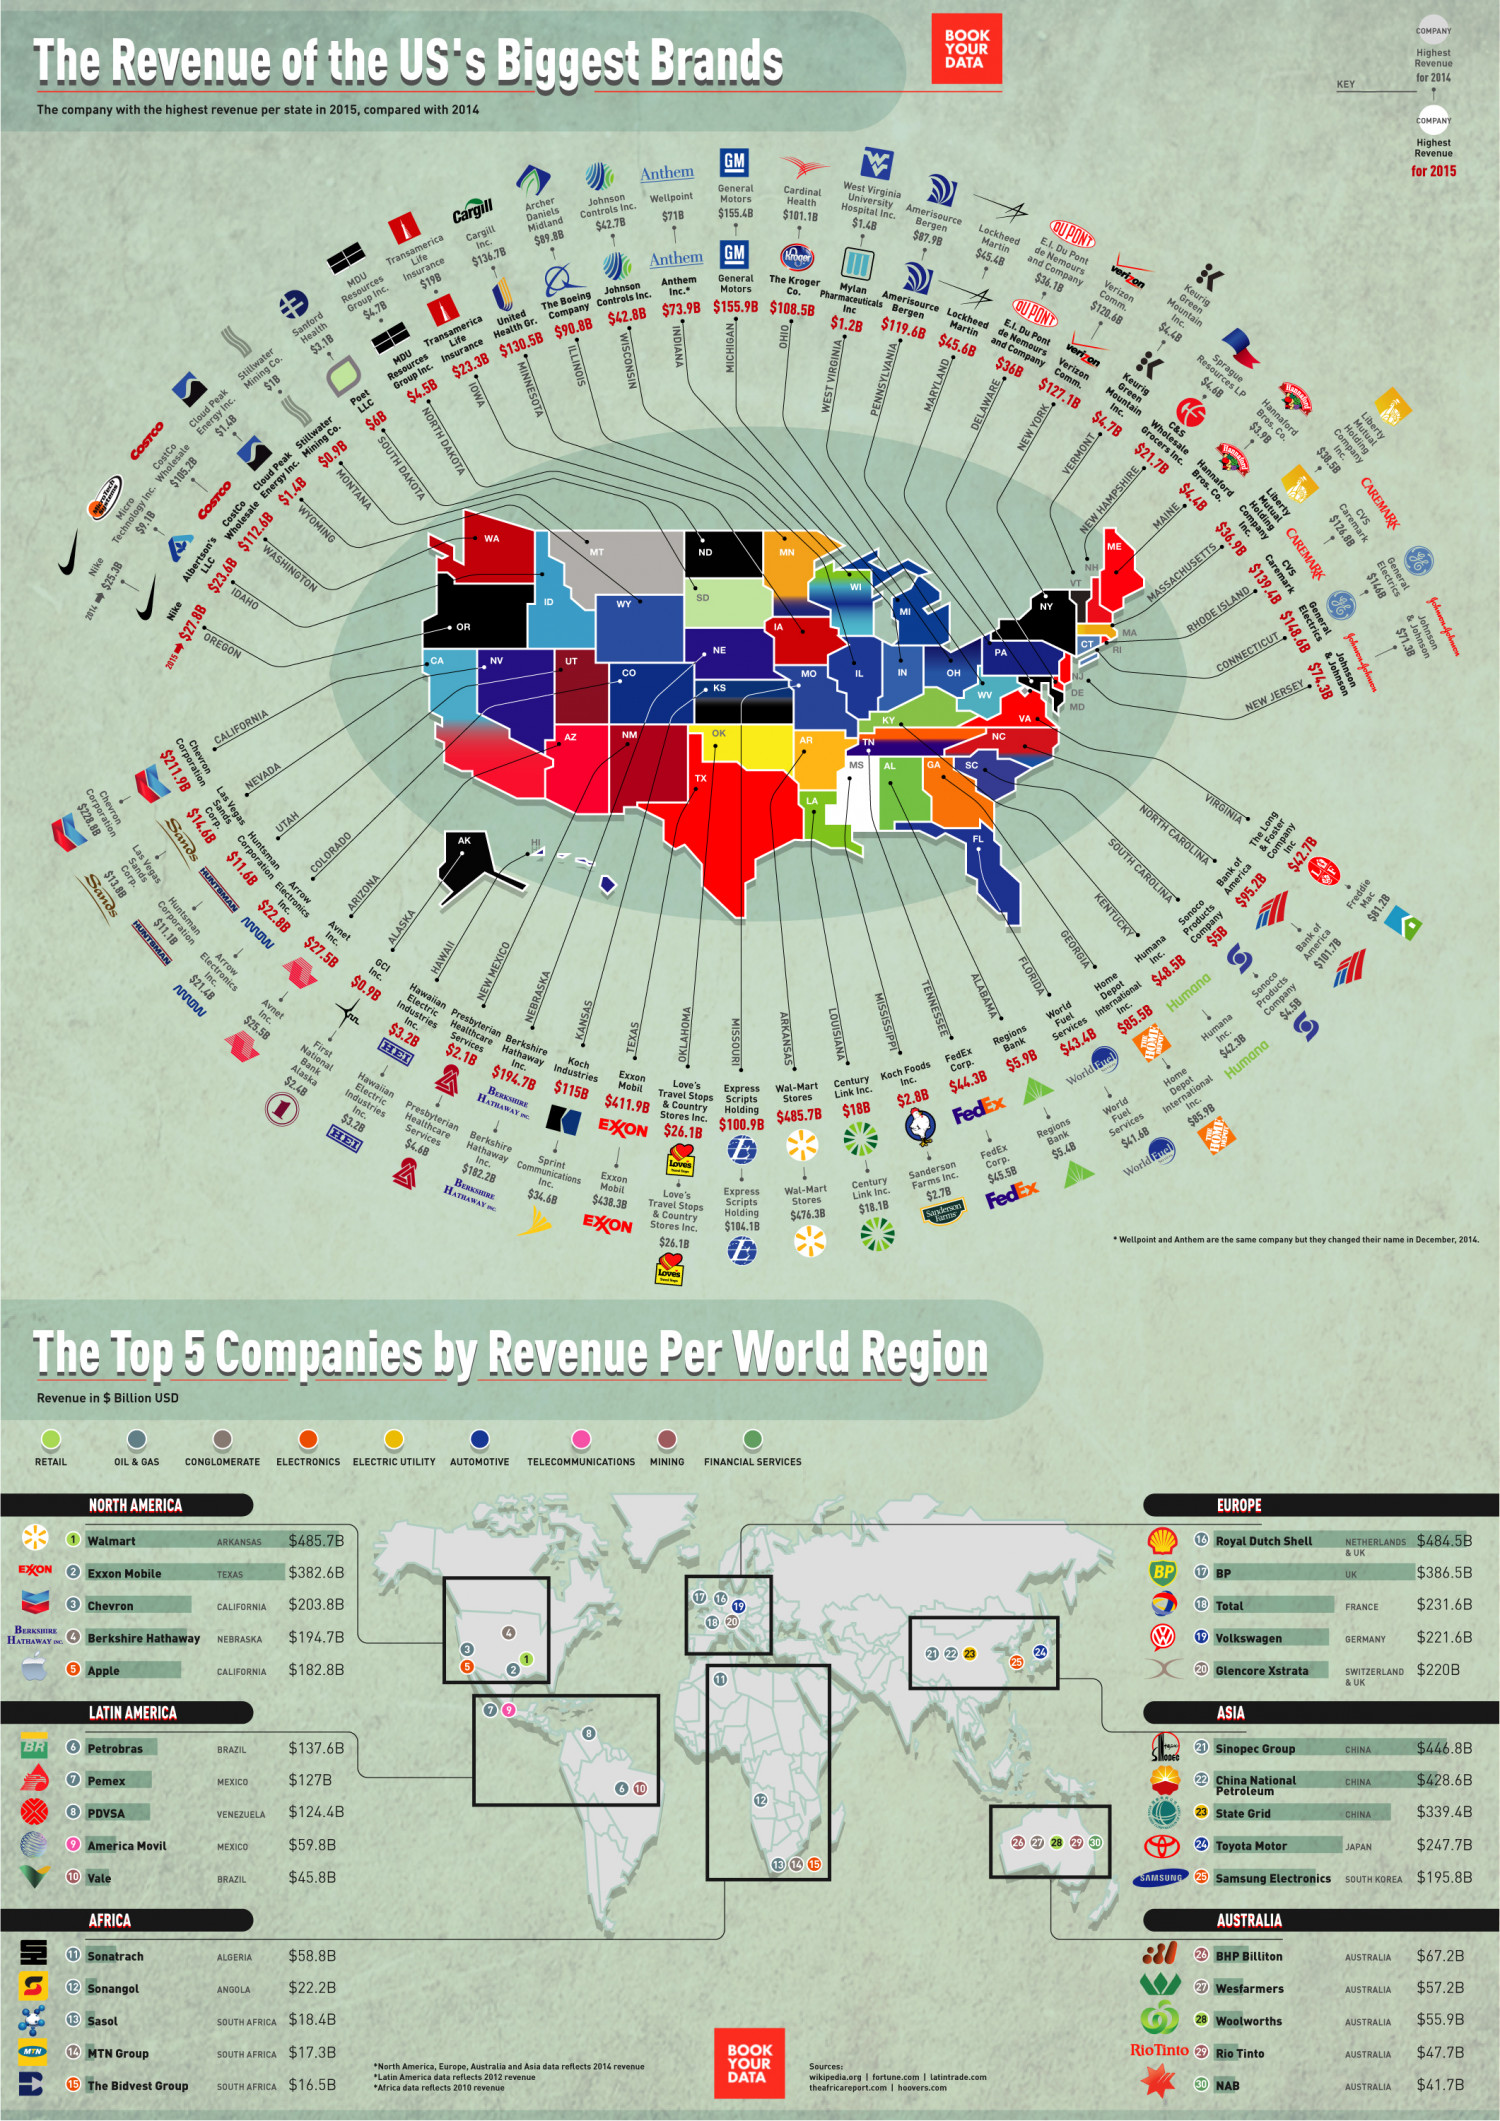
COMPANY The Revenue of the US's Biggest Brands BOOK YOUR DATA Highest Revenue for 2014 KEY The company with the highest revenue per state in 2015, compared with 2014 COMPANY Highest Revenue GM Anthem for 2015 West Virginia University Hospital Inc. $1.4B General Motors Cardinal Health Wellpoint Archer Daniels Midland $89.8B Johnson Amerisource # UPOND Cargill $155.4B Controls Inc. $71B $101.1B Bergen $42.7B Cargill Inc. Lockheed Martin $45.4B $87.9B Transamerica Life E.I. Du Pont de Nemours and Company Anthem GM Kroger Insurance $19B $136.7B Resources Group Inc. $4.7B $36.1B QU POND Amerisource Lockheed de Nemours Anthem Inc.* General Motors The Kroger Co. MDU United Health Gr. Company Controls Inc. Mylan Pharmaceuticals Bergen Keurig Mount? Johnson The Boeing Inc Sanford Health $3.1B Transamerica Life Martin $119.6B $45.6B Inc. $1.2B E.I. Du Pont $4.4B and Company Comm. Mining Co. $1B Resources Group Inc. Insurance $36B $4.5B $23.3B $130.5B $90.8B $42.8B $73.9B $155.9B $108.5B MDU Ou gue Keurig Green Stillwater HAnnalo Inc. y Who s 4.7B $21.7B $3.9B $1.48 Hanne $0.9B Hannaford Cloud Peak Stillwater Costle Energy Inc. Mining Co. MAINE WA SUINGTON WASHINGTON ME мT ND MN NH. WI VT IDAHO SD MASSACHUSETTS WY NY MI OR IA |MA RHODE ISLAND OREGON CT NE PA RI CA NV UT CONNECTICUT co мо IL IN он • KS DE wv V MD NEW JERSEY KY VA AZ NM ок NC CALIFORNIA AR TN MS AL GA SC TX NEVADA VIRGINIA S s Huntsm LA NORTH CAROLINA UTAH S Opa AK SOUTH CAROLINA $22.8B Company $5B Avnet Sonoco Inc. $27.5B Humana Inc. Arrow Electronics GCI Inc. Home Depot Sonoco Products Company $0.9B $48.5B Hawaiian Presbyterian Berkshire Electric Industries Services International $85.5B Avnet World Fuel Humana Ic. Inc. $25.5B Humana Inc. Ic. Healthcare Hathaway Industries Services $3.2B Regions Bank First National HEI $2.1B $194.7B $115B $411.9B $43.4B FedEx Corp. Koch $42.3B Bank Alaska Century Koch Foods Link Inc. $5.9B Inc. Exxon Mobil Home Depot Hawaiian Humana International Inc. $2.4B World Euel Inc. Electric Industries Love's Travel Stops Scripts Wal-Mart Stores $44.3B Express BERKSHIRE HATHAWAY INC. $2.8B & Country Stores Inc. World Fuel Presbyterian Berkshire Healthcare Services Holding $18B Inc. $3.2B HEI $485.7B FedEx EXON $26.1B $100.9B Regions Bank $85.9B Services $4.6B Hathaway Communications $41.6B FedEx Corp. $5.4B Sprint Inc. $182.2B Loves Sanderson Farms Inc. $2.7B World Euel Exxon Mobil Century Link Inc. $45.5B Inc. BERKSHIRE HATHAWAY INC. Wal-Mart Stores $476.3B $34.6B Love's Travel Stops & Country Stores Inc. Express Scripts Holding $104.1B $438.3B FedEx $18.1B SFarms EXON $26.1B * Wellpoint and Anthem are the same company but they changed their name in December, 2014. Loves The Top 5 Companies by Revenue Per World Region Revenue in $ Billion USD RETAIL OIL & GAS CONGLOMERATE ELECTRONICS ELECTRIC UTILITY AUTOMOTIVE TELECOMMUNICATIONS MINING FINANCIAL SERVICES NORTH AMERICA EUROPE $485.7B 16 Royal Dutch Shell NETHERLANDS $484.5B & UK 1 Walmart ARKANSAS EXON 2 EXxon Mobile $382.6B BP 17 BP $386.5B TEXAS UK Chevron $203.8B 18 Total $231.6B CALIFORNIA FRANCE 18 20 BERKSHIRE HATHAWAY INC. 4 Berkshire Hathaway $194.7B 19 Volkswagen $221.6B NEBRASKA GERMANY 21 22 23 5 Apple $182.8B 20 Glencore Xstrata SWITZERLAND $220B CALIFORNIA 11 & UK LATIN AMERICA ASIA BR 6 Petrobras $137.6B 21 Sinopec Group Nopec $446.8B BRAZIL CHINA $127B 22 China National Petroleum $428.6B 7 Pemex MEXICO CHINA 12 8 PDVSA $124.4B 23 State Grid $339.4B VENEZUELA CHINA 9 America Movil $59.8B 24 Toyota Motor $247.7B MEXICO JAPAN 13 14 15 10 Vale $45.8B SAMSUNG 25 Samsung Electronics SOUTH KOREA $195.8B BRAZIL AFRICA AUSTRALIA 10 Sonatrach $58.8B 26 BHP Billiton $67.2B ALGERIA AUSTRALIA 12 Sonangol $22.2B 27 Wesfarmers $57.2B ANGOLA AUSTRALIA 13 Sasol SOUTH AFRICA $18.4B 28 Woolworths $55.9B AUSTRALIA RioTinto 29 Rio Tinto BOOK YOUR DATA MTN 14 MTN Group SOUTH AFRICA $17.3B $47.7B AUSTRALIA *North America, Europe, Australia and Asia data reflects 2014 revenue Sources: wikipedia.org | fortune.com | latintrade.com theafricareport.com | hoovers.com *Latin America data reflects 2012 revenue 15 The Bidvest Group SOUTH AFRICA $16.5B 30 NAB $41.7B *Africa data reflects 2010 revenue AUSTRALIA Liberty Mutual Holding Company Hannaford MARYLAND PENNSYLVANIA, Inc. $38.5B CAREMARK Bros. Co. Liberty Mutual CVs Caremark $126.8B DELAWARE, $4.4B NEW YORK WEST VIRGINIA, VERMONT opanly CAREMARK Gctrics 636.9B $139.4B $148.6B $74.38 $146B Cys Carer NEW HAMPSHIRE. **NORTH DAKOTA Cloud Peak Energy Inc. 9 SOUTH DAKOTA General Electri *MONTANA COSTCO WYOMING $105.2B pajanik nc. Micro Technology Ind $9.1B 0jouy COSTCO Albertson's The Long Com Inc $42.7B Nike oster Nike Bank of America OF 2014 $25.3B 15 $27.8B $23.6B $112.6B $1.48 $81.2B $95.2B Bank of America $101.7B KENTUCKY Products GEORGIA cheation $211.9B Las Vegas Huoratio FLORIDA $4.58 Corp. $14.6B ALABAMA TENNESSEE Conevron Corporati $11.6B Sands HUNTSMAN Corpor $228.8B MISSISSIPPI COLORADO Las ve LOUISIANA San : ARIZONA N EW MEXICO $13.8B Sands Inc. ARKANSAS IIVM ALASKA MISSOURI HAWAI ration $11.1 HUNTSMAN NEBRASKA KANSAS .OKLAHOMA TEXAS Inc. $21.4B
The Revenue of the US's Biggest Brands
Source
https://www....est-brandsCategory
BusinessGet a Quote
You may also like...