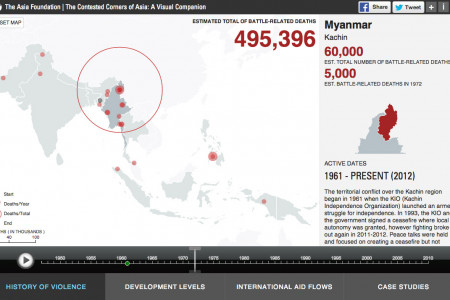
Transcribed
Infographic data visualization
12 MONTHS 365 PROJECT 365 PROJECT 2009 THE CHRONICLES OF PYRAMIDS www.LEMONGRAPHIC.SG 12 MONTHS 365 PROJECT 365 PROJECT 2009 THE CHRONICLES OF PYRAMIDS www.LEMONGRAPHIC.SG 12 MONTHS 365 PROJECT 365 PROJECT 2009 THE CHRONICLES OF PYRAMIDS www.LEMONGRAPHIC.SG 12 MONTHS 365 PROJECT 365 PROJECT 2009 THE CHRONICLES OF PYRAMIDS www.LEMONGRAPHIC.SG 12 MONTHS 365 PROJECT 365 PROJECT 2009 THE CHRONICLES OF PYRAMIDS www.LEMONGRAPHIC.SG 12 MONTHS 365 PROJECT 365 PROJECT 2009 THE CHRONICLES OF PYRAMIDS www.LEMONGRAPHIC.SG
Infographic data visualization
shared by rmmojado on Dec 24
731
views
0
faves
0
comments
This is a Introduction poster for my Project 365 Graphical degree Project 2010. Each pyramids represents the amount of data collected for each month and the colors is categorized in 12 different month...
s. A statistics charts is accompany by the poster to create an overview of information of the design.

Source
http://lemon...-211670032Category
Social MediaGet a Quote
You may also like...