The world in carbon dioxide emissions
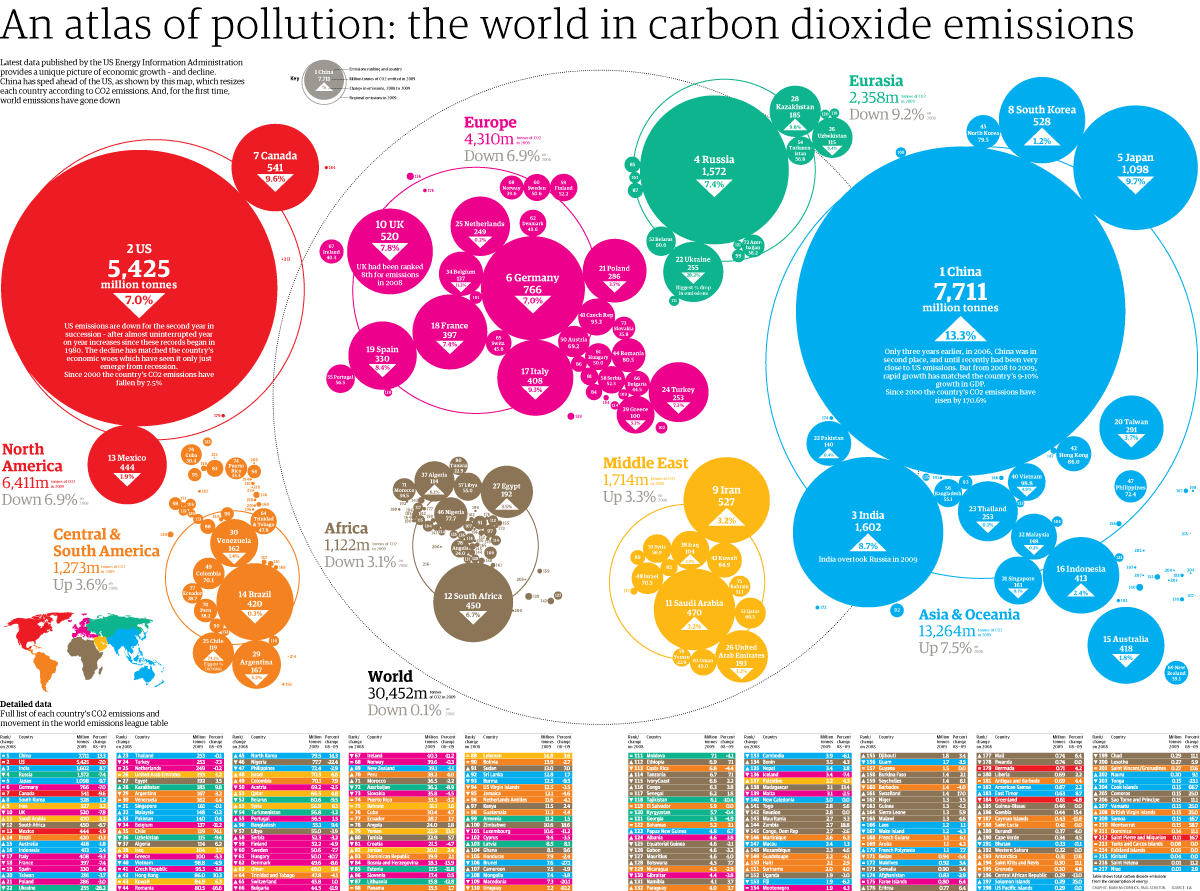
An atlas of pollution: the world in carbon dioxide emissions Latest data published by the US Energy Information Administration provides a unique picture of economic growth - and decline. China has sped ahead of the US, as shown by this map, which resizes each country according to C02 emissions. And, for the first time, world emissions have gone down arat Lumminan IChina Eurasia 2,358m Down 9.2% ndor 8 South Korea Kazakhstan 185 Europe 4,310m Down 6.9%. 528 Nerta Koeea Uekistan 12% Takecs 7 Canada 5 Japan 1,098 9.7% utan 4 Russia 541 1,572 9.6% Morway e Taln 7.4% 10 UK 520 25 Netherlands 249 S3laras 2 US 7.8% to Inlnd 22 Ukraine 5,425 1 China 7,711 UK had been ranked sth for emissions 21 Poland 255 3ABelgium 6 Germany 766 7.0% 286 million tonnes in 2008 7.0% million tonnes 4Cech Rep 953 US emissions are down for the second year in succession-alter almost uninterrupted year on year incresses since these tecords began in 1980. The decline has matched the country's economic woes which have seem it only just emerge trom recession. Since 2000 the country's CO2 emissions have fallen by 75% 18 France 13.3% 397 7.4% 19 Spain 330 454 Only three years earlier, in 2006, China was in second place, and until secently had boen very dose to US emissions, But from 2008 to 2009. rapid growth has matched the courtry's 9-10% rowth in GDP. Since 2000 the country's Co2 emissions have risen by 170. Remania 17 Italy 408 SPertagl SSertu sak Irlana 24 Turkey 253 29Geeece 100 20 Talwan 291 3.7% 3Paktan H0 North America 6,41lm Down 6.9% lerg Keng 13 Mexico Middle East 1,714m Up 3.3% . Taxaia 444 1.9 37 Algeia 14 40 Vietam 47 27 ayp 192 STLy Poptes 9 Iran 527 Monca 724 23 Thalland 46 Nigeria 3.2%% 3 India 253 Africa 1,122m Down 3.1% 1,602 Central & South America 1,273m: Up 3.6% 30 2Malaysia Venezuela 8.7% India overtook Russia in 2009 162 161ndonesia 413 Colombla Singapooe 161 ack sdrhes 14 Brazil 12 South Africa 11 Saudi Arabia 420 420 450 Asia & Oceania 13,264m: Up 7.5%- 6.7% 15 Australia 25 chile 19 26 Unted 418 Arab Eimitates Argentina 167 193 World 30,452m Down 0.1% - alund : Detailed data Full list of each country's CO2 emissions and movement in the world emissions league table Moe Pe M Pemi en che M Pe chemp che 733 3 727 24 24 29 18 34 074 64 0.2 425 20 म . 24 Takey D5 Netheriand 253 15 41 1 Gua 17 200 Lesotha 240 02 LS00 D 12 mada 382 4D 128 67 LOs 35 345 A9 Seychelies 14 -20 042 5 Amria Mlgscat CR Arerke Se A Ta 1335 IM Geld Cemary 047 063 A5 Coma 015 Hew Catedr 30 00 015 Sape sahador 10 ILS 24 D46 S6A 33 P n 34 begu 140 17 013 167 VESouth a weey 2 Beeglidesh A100 Deute V10 Lambon 450 34 240 27 273 and 36 6 V7 Mak and CM Pch Calay A Derand जड 94 AM Sete 2.3 A Teisa 46 167 4 개 416 40 24 108 52.2 AN fanch Poimnu 22 41 204 Swndm Aartan I04 Chuna 36 12 Ca 27 4 idandand 17 hay THHangr AD Dacanlep वई 217 H -49 436 86 38.3 459 05 0.30 IL 4 Cch AXDHorg krg 107 Cameon 173 Sam 195 Gres AK Ceican aepulie 9 34 0.30 200 303 4 Treied Tbag 438 14 CES2 Ugana ১ 233 58 28 17 C175 Fare Ina 080 64 0.29 50 T rptonate 295 44 Romae 445 -154 Me gs 64
The world in carbon dioxide emissions
Source
Unknown. Add a sourceCategory
EnvironmentGet a Quote


