Animated urban growth from 1950 to 2050 on a 3D Globe

SeeingStructure, ianmritchie and gmz like this.
< / > Click here to embed this graphic on your website
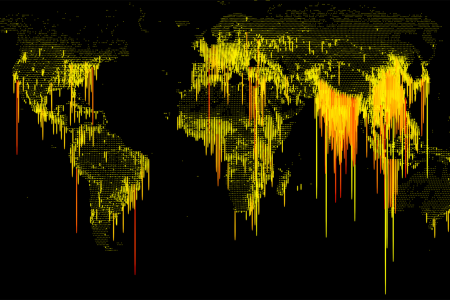
In browser visualization of the urban growth from 1950 to 2050. This visualization animates the period from 1950 to 2050 on a 3D Globe
Credits
Published by
Unknown. Add credit
Designed by josdirksen
More Info

Added: 8 months ago

Rank: 202 of 429 in Geography

Tags: population, 3D

Source: http://www.smartjava.org

Incorrect or Missing URL? Let us know


Liked by 3 People

SeeingStructure
635 followers
309 infographics
ianmritchie
2 followers
0 infographics
gmz
11 followers
13 infographics
Show More

Embed Code