Environmental Policy
Trending
-
Recent
-
Viewed
-
Faved
-
Commented
Staff Picks
Filter By :
-
All
-
Infographic
-
Video
-
Interactive
-
Presentation


The Power of EPAct

938
4
2


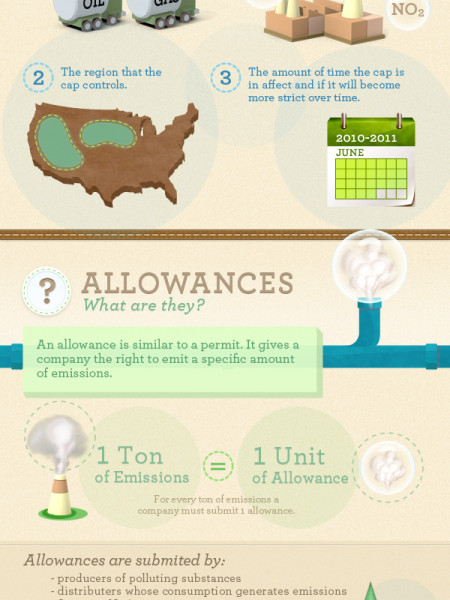
Cap and Trade
425
2

We don't have any Visuals to
show you in this category.
