
Effective EU Corporate Tax Rates
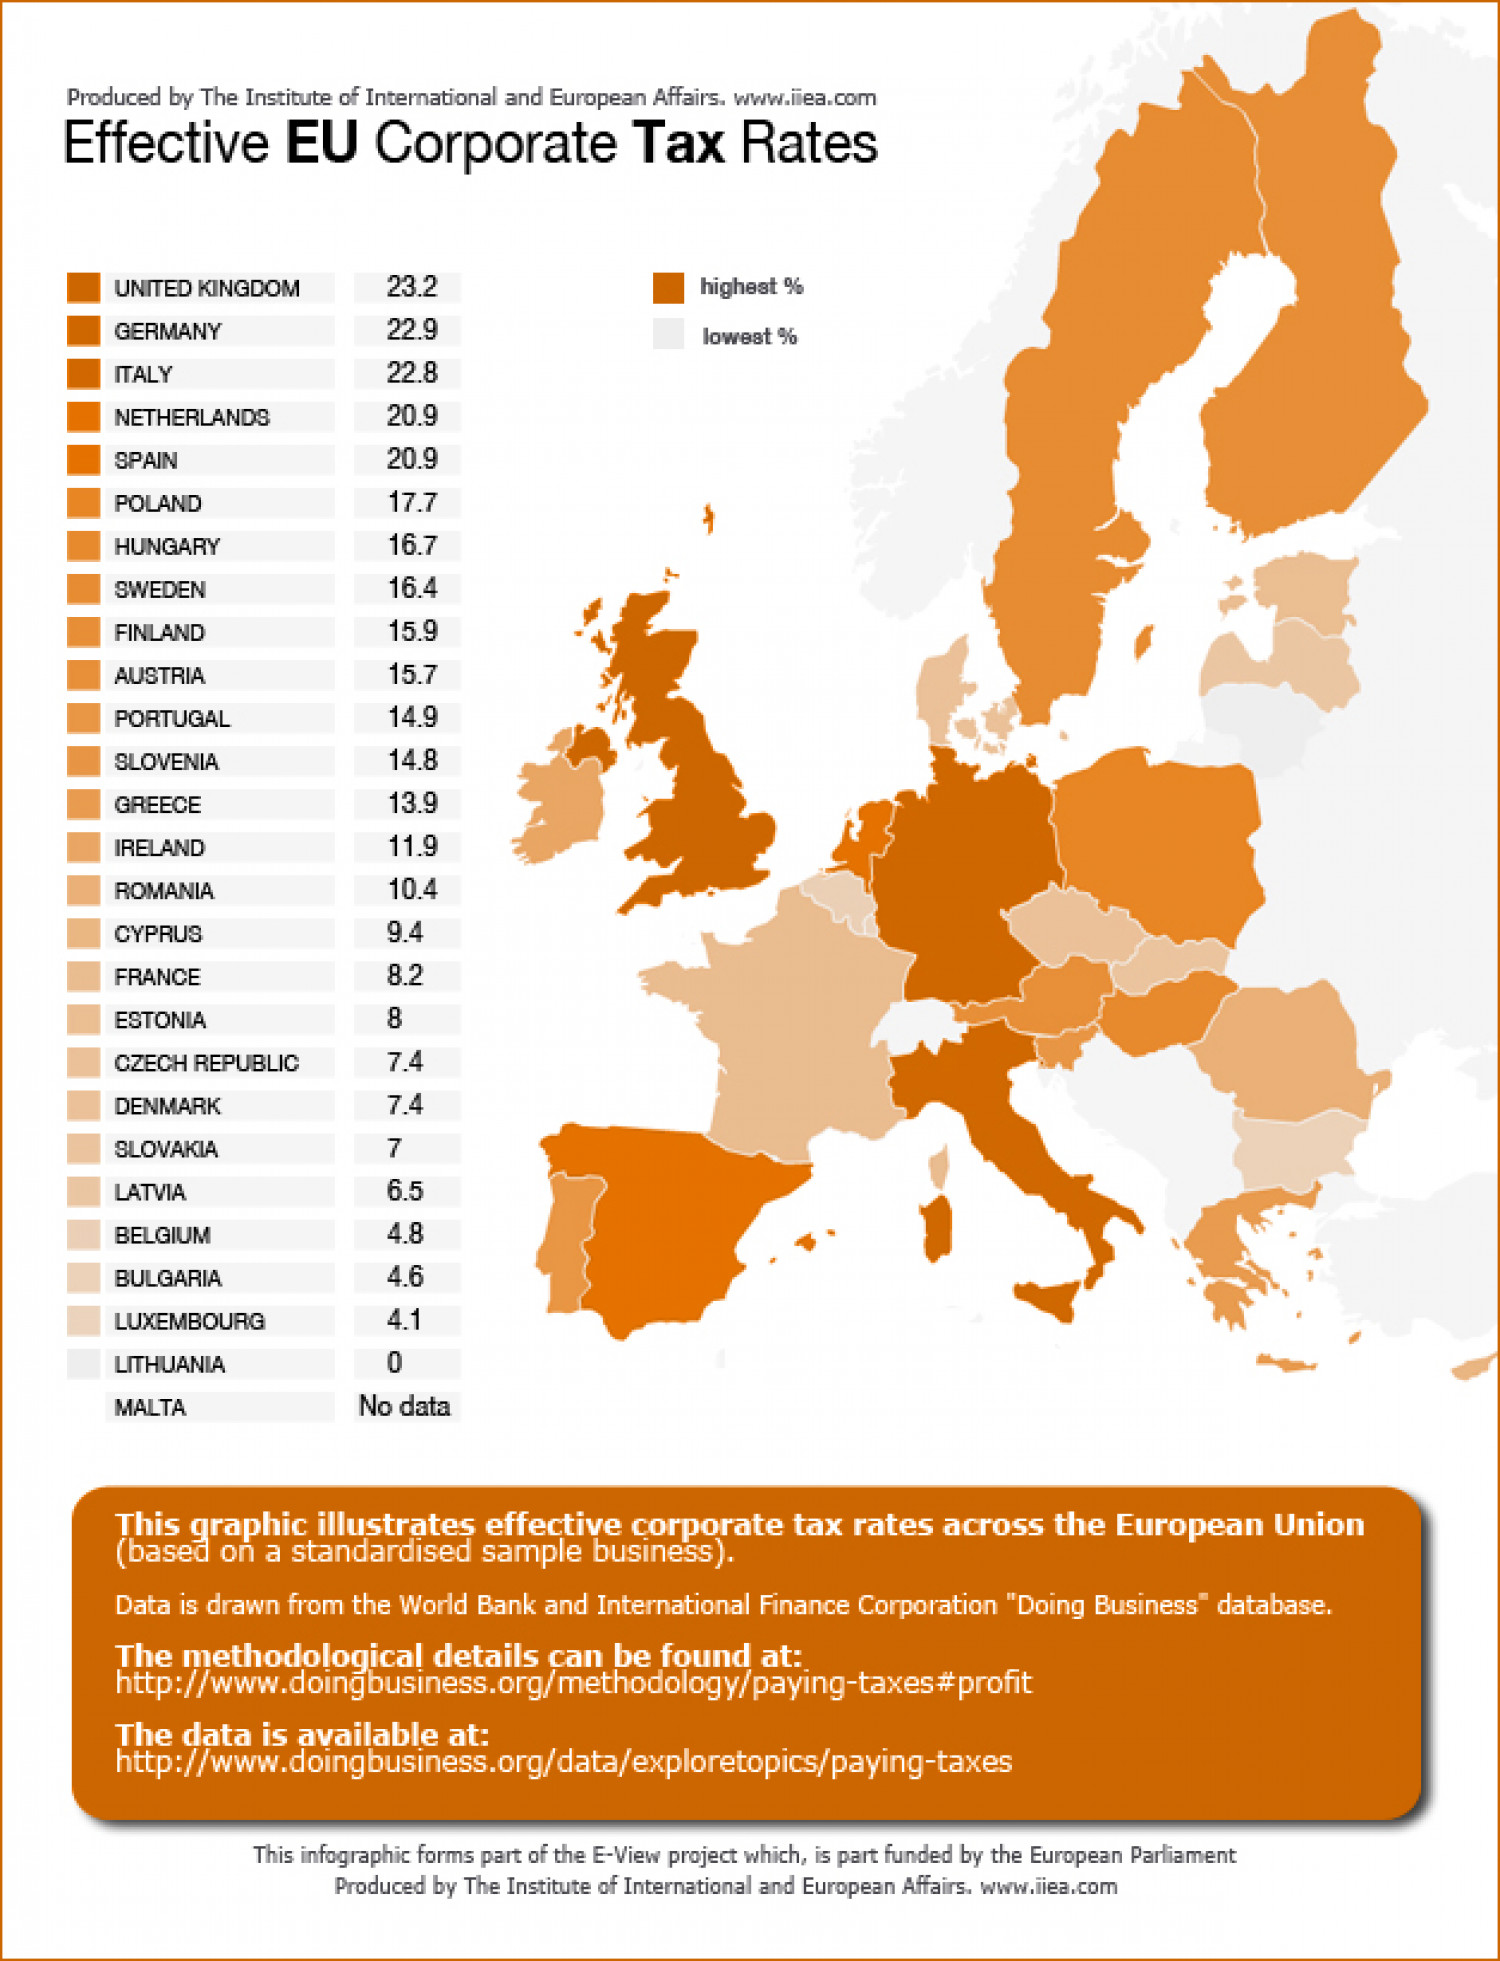
Produced by The Institute of International and European Affairs. www.iea.com Effective EU Corporate Tax Rates UNITED KINGDOM 23.2 highest % GERMANY 22.9 lowest % ITALY 22.8 NETHERLANDS 20.9 SPAIN 20.9 POLAND 17.7 HUNGARY 16.7 SWEDEN 16.4 FINLAND 15.9 AUSTRIA 15.7 PORTUGAL 14.9 SLOVENIA 14.8 GREECE 13.9 IRELAND 11.9 ROMANIA 10.4 CYPRUS 9.4 FRANCE 8.2 ESTONIA CZECH REPUBLIC 7.4 DENMARK 7.4 SLOVAKIA LATVIA 6.5 BELGIUM 4.8 BULGARIA 4.6 LUXEMBOURG 4.1 LITHUANIA MALTA No data This graphic illustrates effective corporate tax rates across the European Union (based on a standardised sample business). Data is drawn from the World Bank and International Finance Corporation "Doing Business" database. The methodological details can be found at: http://www.doingbusiness.org/methodology/paying-taxes#profit The data is available at: http://www.doingbusiness.org/data/exploretopics/paying-taxes This infographic forms part of the E-View project which, is part funded by the European Parliament Produced by The Institute of International and European Affairs. www.iea.com Produced by The Institute of International and European Affairs. www.iea.com Effective EU Corporate Tax Rates UNITED KINGDOM 23.2 highest % GERMANY 22.9 lowest % ITALY 22.8 NETHERLANDS 20.9 SPAIN 20.9 POLAND 17.7 HUNGARY 16.7 SWEDEN 16.4 FINLAND 15.9 AUSTRIA. 15.7 PORTUGAL 14.9 SLOVENIA 14.8 GREECE 13.9 IRELAND 11.9 ROMANIA 10.4 CYPRUS 9.4 FRANCE 8.2 ESTONIA CZECH REPUBLIC 7.4 DENMARK 7.4 SLOVAKIA 7 LATVIA 6.5 BELGIUM 4.8 BULGARIA 4.6 LUXEMBOURG 4.1 LITHUANIA MALTA No data This graphic illustrates effective corporate tax rates across the European Union (based on a standardised sample business). Data is drawn from the World Bank and International Finance Corporation "Doing Business" database. The methodological details çan bþe found at: http://www.doingbusiness.org/methodology/paying-taxes#profit The data is available at: http://www.doingbusiness.org/data/exploretopics/paying-taxes This infographic forms part of the E-View project which, is part funded by the European Parliament Produced by The Institute of International and European Affairs. www.iea.com Produced by The Institute of International and European Affairs. www.iea.com Effective EU Corporate Tax Rates UNITED KINGDOM 23.2 highest % GERMANY 22.9 lowest % ITALY 22.8 NETHERLANDS 20.9 SPAIN 20.9 POLAND 17.7 HUNGARY 16.7 SWEDEN 16.4 FINLAND 15.9 AUSTRIA. 15.7 PORTUGAL 14.9 SLOVENIA 14.8 GREECE 13.9 IRELAND 11.9 ROMANIA 10.4 CYPRUS 9.4 FRANCE 8.2 ESTONIA CZECH REPUBLIC 7.4 DENMARK 7.4 SLOVAKIA 7 LATVIA 6.5 BELGIUM 4.8 BULGARIA 4.6 LUXEMBOURG 4.1 LITHUANIA MALTA No data This graphic illustrates effective corporate tax rates across the European Union (based on a standardised sample business). Data is drawn from the World Bank and International Finance Corporation "Doing Business" database. The methodological details çan bþe found at: http://www.doingbusiness.org/methodology/paying-taxes#profit The data is available at: http://www.doingbusiness.org/data/exploretopics/paying-taxes This infographic forms part of the E-View project which, is part funded by the European Parliament Produced by The Institute of International and European Affairs. www.iea.com Produced by The Institute of International and European Affairs. www.iea.com Effective EU Corporate Tax Rates UNITED KINGDOM 23.2 highest % GERMANY 22.9 lowest % ITALY 22.8 NETHERLANDS 20.9 SPAIN 20.9 POLAND 17.7 HUNGARY 16.7 SWEDEN 16.4 FINLAND 15.9 AUSTRIA. 15.7 PORTUGAL 14.9 SLOVENIA 14.8 GREECE 13.9 IRELAND 11.9 ROMANIA 10.4 CYPRUS 9.4 FRANCE 8.2 ESTONIA CZECH REPUBLIC 7.4 DENMARK 7.4 SLOVAKIA 7 LATVIA 6.5 BELGIUM 4.8 BULGARIA 4.6 LUXEMBOURG 4.1 LITHUANIA MALTA No data This graphic illustrates effective corporate tax rates across the European Union (based on a standardised sample business). Data is drawn from the World Bank and International Finance Corporation "Doing Business" database. The methodological details çan bþe found at: http://www.doingbusiness.org/methodology/paying-taxes#profit The data is available at: http://www.doingbusiness.org/data/exploretopics/paying-taxes This infographic forms part of the E-View project which, is part funded by the European Parliament Produced by The Institute of International and European Affairs. www.iea.com Produced by The Institute of International and European Affairs. www.iea.com Effective EU Corporate Tax Rates UNITED KINGDOM 23.2 highest % GERMANY 22.9 lowest % ITALY 22.8 NETHERLANDS 20.9 SPAIN 20.9 POLAND 17.7 HUNGARY 16.7 SWEDEN 16.4 FINLAND 15.9 AUSTRIA. 15.7 PORTUGAL 14.9 SLOVENIA 14.8 GREECE 13.9 IRELAND 11.9 ROMANIA 10.4 CYPRUS 9.4 FRANCE 8.2 ESTONIA CZECH REPUBLIC 7.4 DENMARK 7.4 SLOVAKIA 7 LATVIA 6.5 BELGIUM 4.8 BULGARIA 4.6 LUXEMBOURG 4.1 LITHUANIA MALTA No data This graphic illustrates effective corporate tax rates across the European Union (based on a standardised sample business). Data is drawn from the World Bank and International Finance Corporation "Doing Business" database. The methodological details çan bþe found at: http://www.doingbusiness.org/methodology/paying-taxes#profit The data is available at: http://www.doingbusiness.org/data/exploretopics/paying-taxes This infographic forms part of the E-View project which, is part funded by the European Parliament Produced by The Institute of International and European Affairs. www.iea.com Produced by The Institute of International and European Affairs. www.iea.com Effective EU Corporate Tax Rates UNITED KINGDOM 23.2 highest % GERMANY 22.9 lowest % ITALY 22.8 NETHERLANDS 20.9 SPAIN 20.9 POLAND 17.7 HUNGARY 16.7 SWEDEN 16.4 FINLAND 15.9 AUSTRIA. 15.7 PORTUGAL 14.9 SLOVENIA 14.8 GREECE 13.9 IRELAND 11.9 ROMANIA 10.4 CYPRUS 9.4 FRANCE 8.2 ESTONIA CZECH REPUBLIC 7.4 DENMARK 7.4 SLOVAKIA 7 LATVIA 6.5 BELGIUM 4.8 BULGARIA 4.6 LUXEMBOURG 4.1 LITHUANIA MALTA No data This graphic illustrates effective corporate tax rates across the European Union (based on a standardised sample business). Data is drawn from the World Bank and International Finance Corporation "Doing Business" database. The methodological details çan bþe found at: http://www.doingbusiness.org/methodology/paying-taxes#profit The data is available at: http://www.doingbusiness.org/data/exploretopics/paying-taxes This infographic forms part of the E-View project which, is part funded by the European Parliament Produced by The Institute of International and European Affairs. www.iea.com Produced by The Institute of International and European Affairs. www.iea.com Effective EU Corporate Tax Rates UNITED KINGDOM 23.2 highest % GERMANY 22.9 lowest % ITALY 22.8 NETHERLANDS 20.9 SPAIN 20.9 POLAND 17.7 HUNGARY 16.7 SWEDEN 16.4 FINLAND 15.9 AUSTRIA. 15.7 PORTUGAL 14.9 SLOVENIA 14.8 GREECE 13.9 IRELAND 11.9 ROMANIA 10.4 CYPRUS 9.4 FRANCE 8.2 ESTONIA CZECH REPUBLIC 7.4 DENMARK 7.4 SLOVAKIA 7 LATVIA 6.5 BELGIUM 4.8 BULGARIA 4.6 LUXEMBOURG 4.1 LITHUANIA MALTA No data This graphic illustrates effective corporate tax rates across the European Union (based on a standardised sample business). Data is drawn from the World Bank and International Finance Corporation "Doing Business" database. The methodological details çan bþe found at: http://www.doingbusiness.org/methodology/paying-taxes#profit The data is available at: http://www.doingbusiness.org/data/exploretopics/paying-taxes This infographic forms part of the E-View project which, is part funded by the European Parliament Produced by The Institute of International and European Affairs. www.iea.com
Effective EU Corporate Tax Rates
Source
Unknown. Add a sourceCategory
EconomyGet a Quote
You may also like...


