Human Development Index
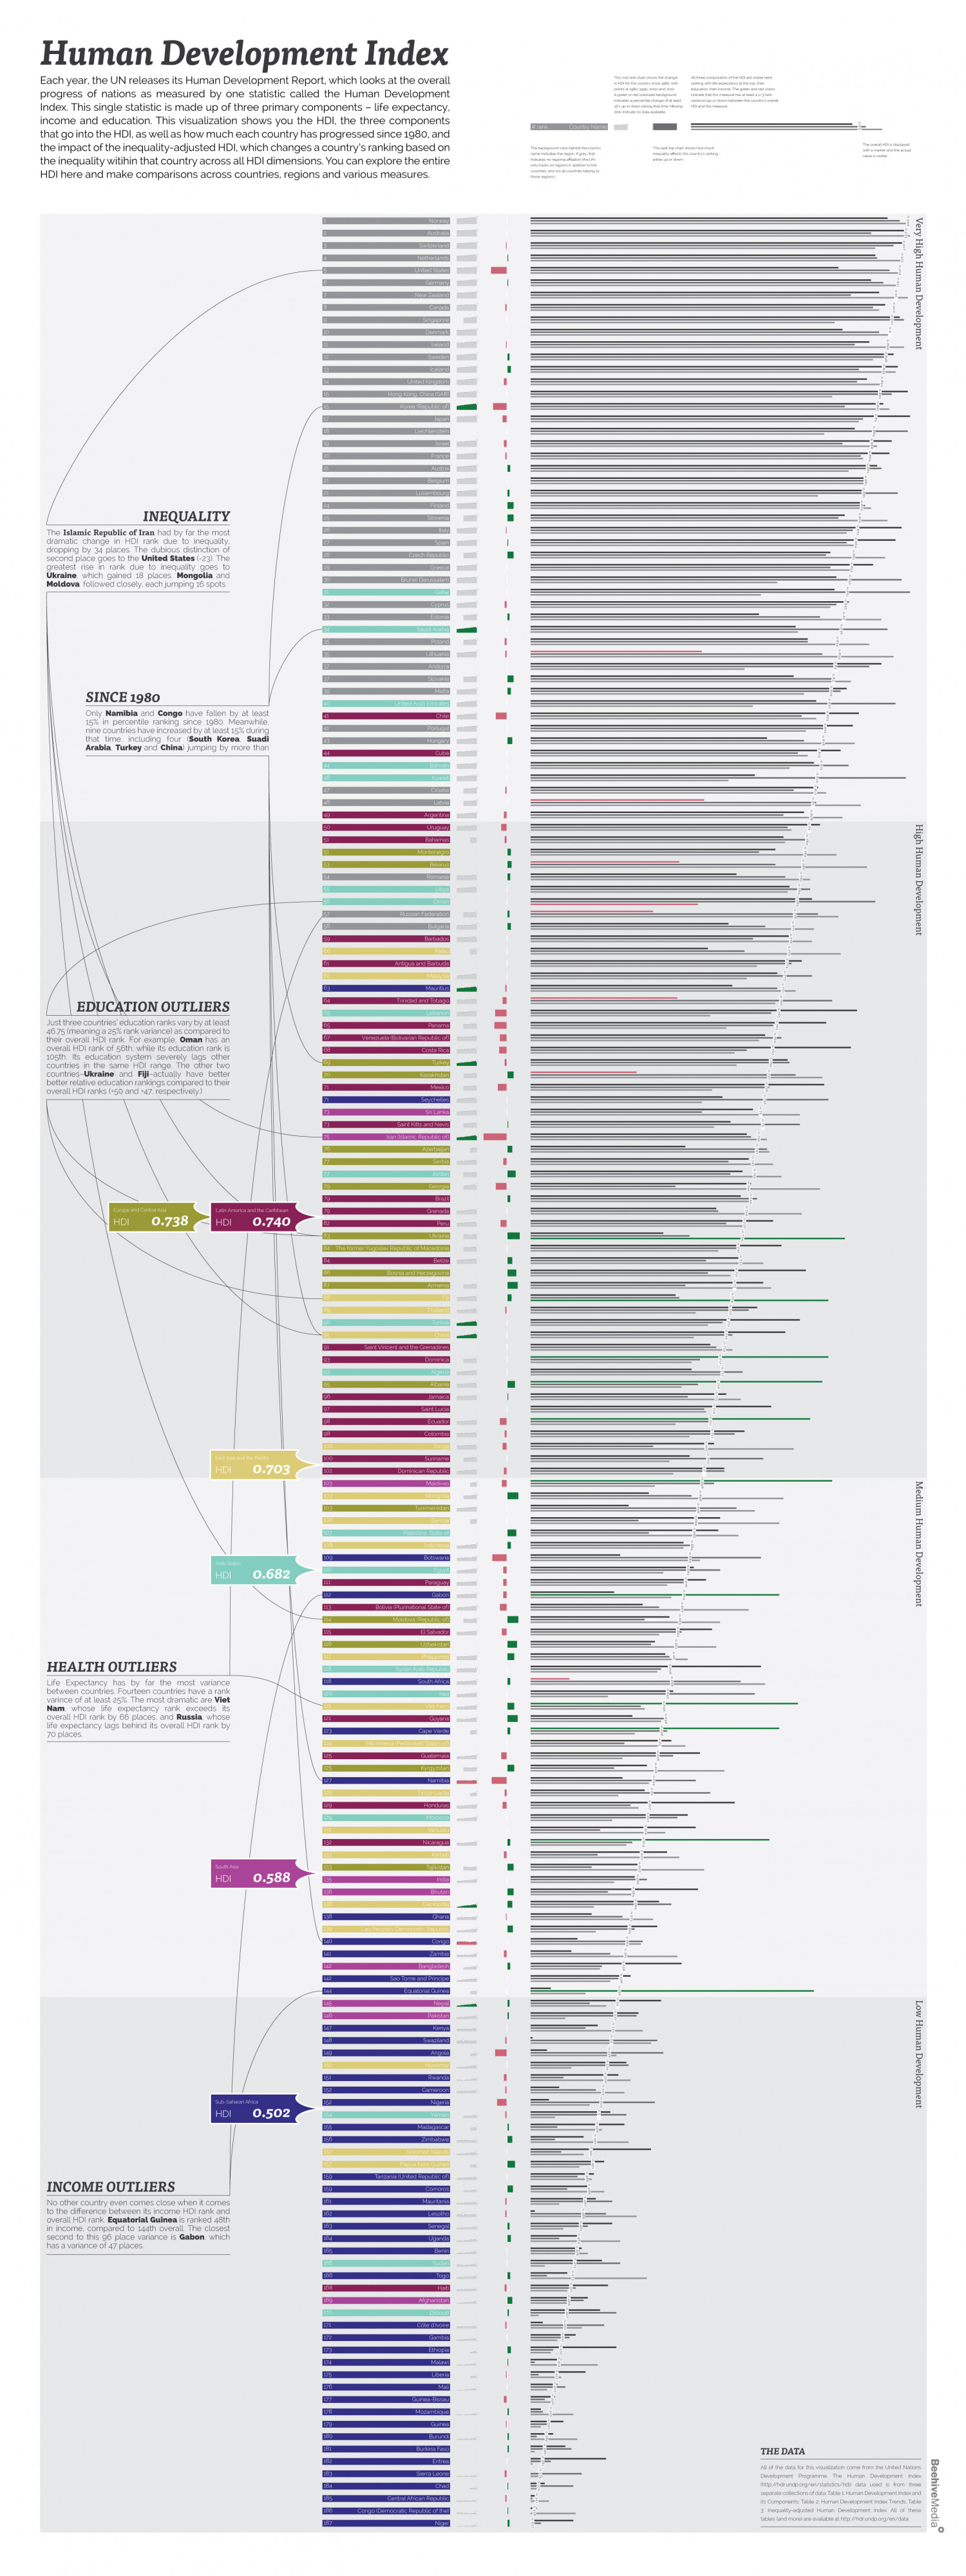
Human Development Index Each year, the UN releases its Human Development Report, which looks at the overall progress of nations as measured by one statistic called the Human Development Index. This single statistic is made up of three primary components - life expectancy, income and education. This visualization shows you the HDI, the three components that go into the HDI, as well as how much each country has progressed since 1980, and the impact of the inequality-adjusted HDI, which changes a country's ranking based on the inequality witihin that country across all HDI dimensions. You can explore the entire HDI here and make comparisons across countries, regions and various measures. This mini line chart shows the change All three components of the HDI are visible here. in HDI for this country since 1980. with points at 1980, 1990, 2000 and 2012. starting with life expectancy at the top. then education, then income. The green and red colors A green or red colorized background indicate that this measure has at least a 1/3 rank indicates a percentile change of at least variance (up or down) between the country's overall 15% up or down during that time. Missing HDLand this measure dots indicate no data available # rank Country Name The overall HDI is displayed The background color behind the country This split bar chart shows how much with a marker and the actual name indicates the region. If grey, that inequality affects this country's ranking - value is visible indicates no regional affiliation (the UN either up or down only tracks six regions in addition to the countries, and not all countries belong to those regions) Norway Australia 3 Switzerland 4 Netherlands United States 6. Germany New Zealand Canada Singapore 10 Denmark 11 Ireland Sweden 13 Iceland 14 United Kingdom 15 Hong Kong, China (SAR) 15 Korea (Republic of) 17 Japan 18 Liechtenstein 19 Israel 20 France Austria Belgium Luxembourg 24 Finland INEQUALITY 25 Slovenia 26 Italy The Islamic Republic of Iran had by far the most dramatic change in HDI rank due to inequality, dropping by 34 places. The dubious distinction of second place goes to the United States (-23). The greatest rise in rank due to inequality goes to Ukraine, which gained 18 places. Mongolia and Moldova followed closely, each jumping 16 spots. 27 Spain 28 Czech Republic 29 Greece 30 Brunei Darussalam Qatar 32 Cyprus 33 Estonia 34 Saudi Arabia 35 Poland 35 Lithuania Andorra Slovakia 39 Malta SINCE 1980 40 United Arab Emirates Only Namibia and Congo have fallen by at least 15% in percentile ranking since 1980. Meanwhile, nine countries have increased by at least 15% during that time, including four (South Korea, Suadi Arabia, Turkey and China) jumping by more than 41 Chile 41 Portugal 43 Hungary 44 Cuba Bahrain 46 Kuwait 47 Croatia 48 Latvia 49 Argentina 50 Uruguay 51 Bahamas Montenegro 53 Belarus 54 Romania 55 Libya 56 Oman 57 Russian Federation 58 Bulgaria 59 Barbados 60 Palau Antigua and Barbuda 62 Malaysia 63 Mauritius 64 Trinidad and Tobago EDUCATION OUTLIERS 65 Lebanon Just three countries' education ranks vary by at least 46.75 (meaning a 25% rank variance) as compared to their overall HDI rank. For example, Oman has an overall HDI rank of 56th, while its education rank is 105th. Its education system severely lags other countries in the same HDI range. The other two countries-Ukraine and Fiji-actually have better better relative education rankings compared to their overall HDI ranks (+50 and +47, respectively.) 65 Panama 67 Venezuela (Bolivarian Republic of) 68 Costa Rica 69 Turkey 70 Kazakhstan 71 Mexico 71 Seychelles 73 Sri Lanka 73 Saint Kitts and Nevis 75 Iran (Islamic Republic of) 76 Azerbaijan 77 Serbia Jordan 79 Georgia 79 Brazil Europe and Central Asia Latin America and the Caribbean 79 Grenada HDI 0.738 HDI 0.740 82 Peru 83 Ukraine 84 The former Yugoslav Republic of Macedonia 84 Belize 86 Bosnia and Herzegovina 87 Armenia 88 Fiji 89 Thailand 90 Tunisia 91 China 91 Saint Vincent and the Grenadines 93 Dominica 93 Algeria 95 Albania 96 Jamaica 97 Saint Lucia 98 Ecuador 98 Colombia 100 Tonga East Asia and the Pacific 100 Suriname HDI 0.703 Dominican Republic 102 103 Maldives 103 Mongolia 103 Turkmenistan 106 Samoa 107 Palestine. State of 108 Indonesia 109 Botswana Arab States 110 Egypt HDI 0.682 111 Paraguay 112 Gabon 113 Bolivia (Plurinational State of) 114 Moldova (Republic of) 115 El Salvador 116 Uzbekistan 117 Philippines HEALTH OUTLIERS 118 Syrian Arab Republic 118 South Africa Life Expectancy has by far the most variance between countries. Fourteen countries have a rank varince of at least 25%. The most dramatic are Viet Nam, whose life expectancy rank exceeds its overall HDI rank by 66 places, and Russia, whose life expectancy lags behind its overall HDI rank by 70 places. 120 Iraq 121 Viet Nam 121 Guyana 123 Cape Verde 124 Micronesia (Federated States of) 125 Guatemala 125 Kyrgyzstan 127 Namibia 128 Timor-Leste 129 Honduras 129 Morocco 131 Vanuatu 132 Nicaragua 133 Kiribati South Asia 133 Tajikistan HDI 0.588 135 India 136 Bhutan 136 Cambodia |138 Ghana 139 Lao People's Democratic Republic 140 Congo 141 Zambia 142 Bangladesh 142 Sao Tome and Principe 144 Equatorial Guinea 145 Nepal 146 Pakistan 147 Kenya 148 Swaziland 149 Angola 150 Myanmar 151 Rwanda 152 Cameroon Sub-Saharan Africa 152 Nigeria HDI 0.502 154 Yemen 155 Madagascar 156 Zimbabwe 157 Solomon Islands 157 Papua New Guinea 159 Tanzania (United Republic of) INCOME OUTLIERS 159 Comoros 161 No other country even comes close when it comes to the difference between its income HDI rank and overall HDI rank. Equatorial Guinea is ranked 48th in income, compared to 144th overall. The closest second to this 96 place variance is Gabon, which has a variance of 47 places. Mauritania 162 Lesotho 163 Senegal 164 Uganda 165 Benin 166 Sudan 166 Togo 168 Haiti 169 Afghanistan 170 Djibouti 171 Côte d'Ivoire 172 Gambia 173 Ethiopia 174 Malawi 175 Liberia 176 Mali 177 Guinea-Bissau 178 Mozambique 179 Guinea 180 Burundi 181 Burkina Faso THE DATA 182 Eritrea All of the data for this visualization come from the United Nations 183 Sierra Leone Development Programme. The Human Development Index 184 Chad (http://hdr.undp.org/en/statistics/hdi) data used is from three separate collections of data. Table 1: Human Development Index and |185 Central African Republic its Components: Table 2: Human Development Index Trends: Table 186 Congo (Democratic Republic of the) 3: Inequality-adjusted Human Development Index. All of these tables (and more) are available at http://hdr.undp.org/en/data. 187 Niger BeehiveMedia Medium Human Development Low Human Development Very High Human Development High Human Development
Human Development Index

Source
http://hdr.undp.org/enCategory
EconomyGet a Quote
You may also like...