
How to Tell Your Story Visually
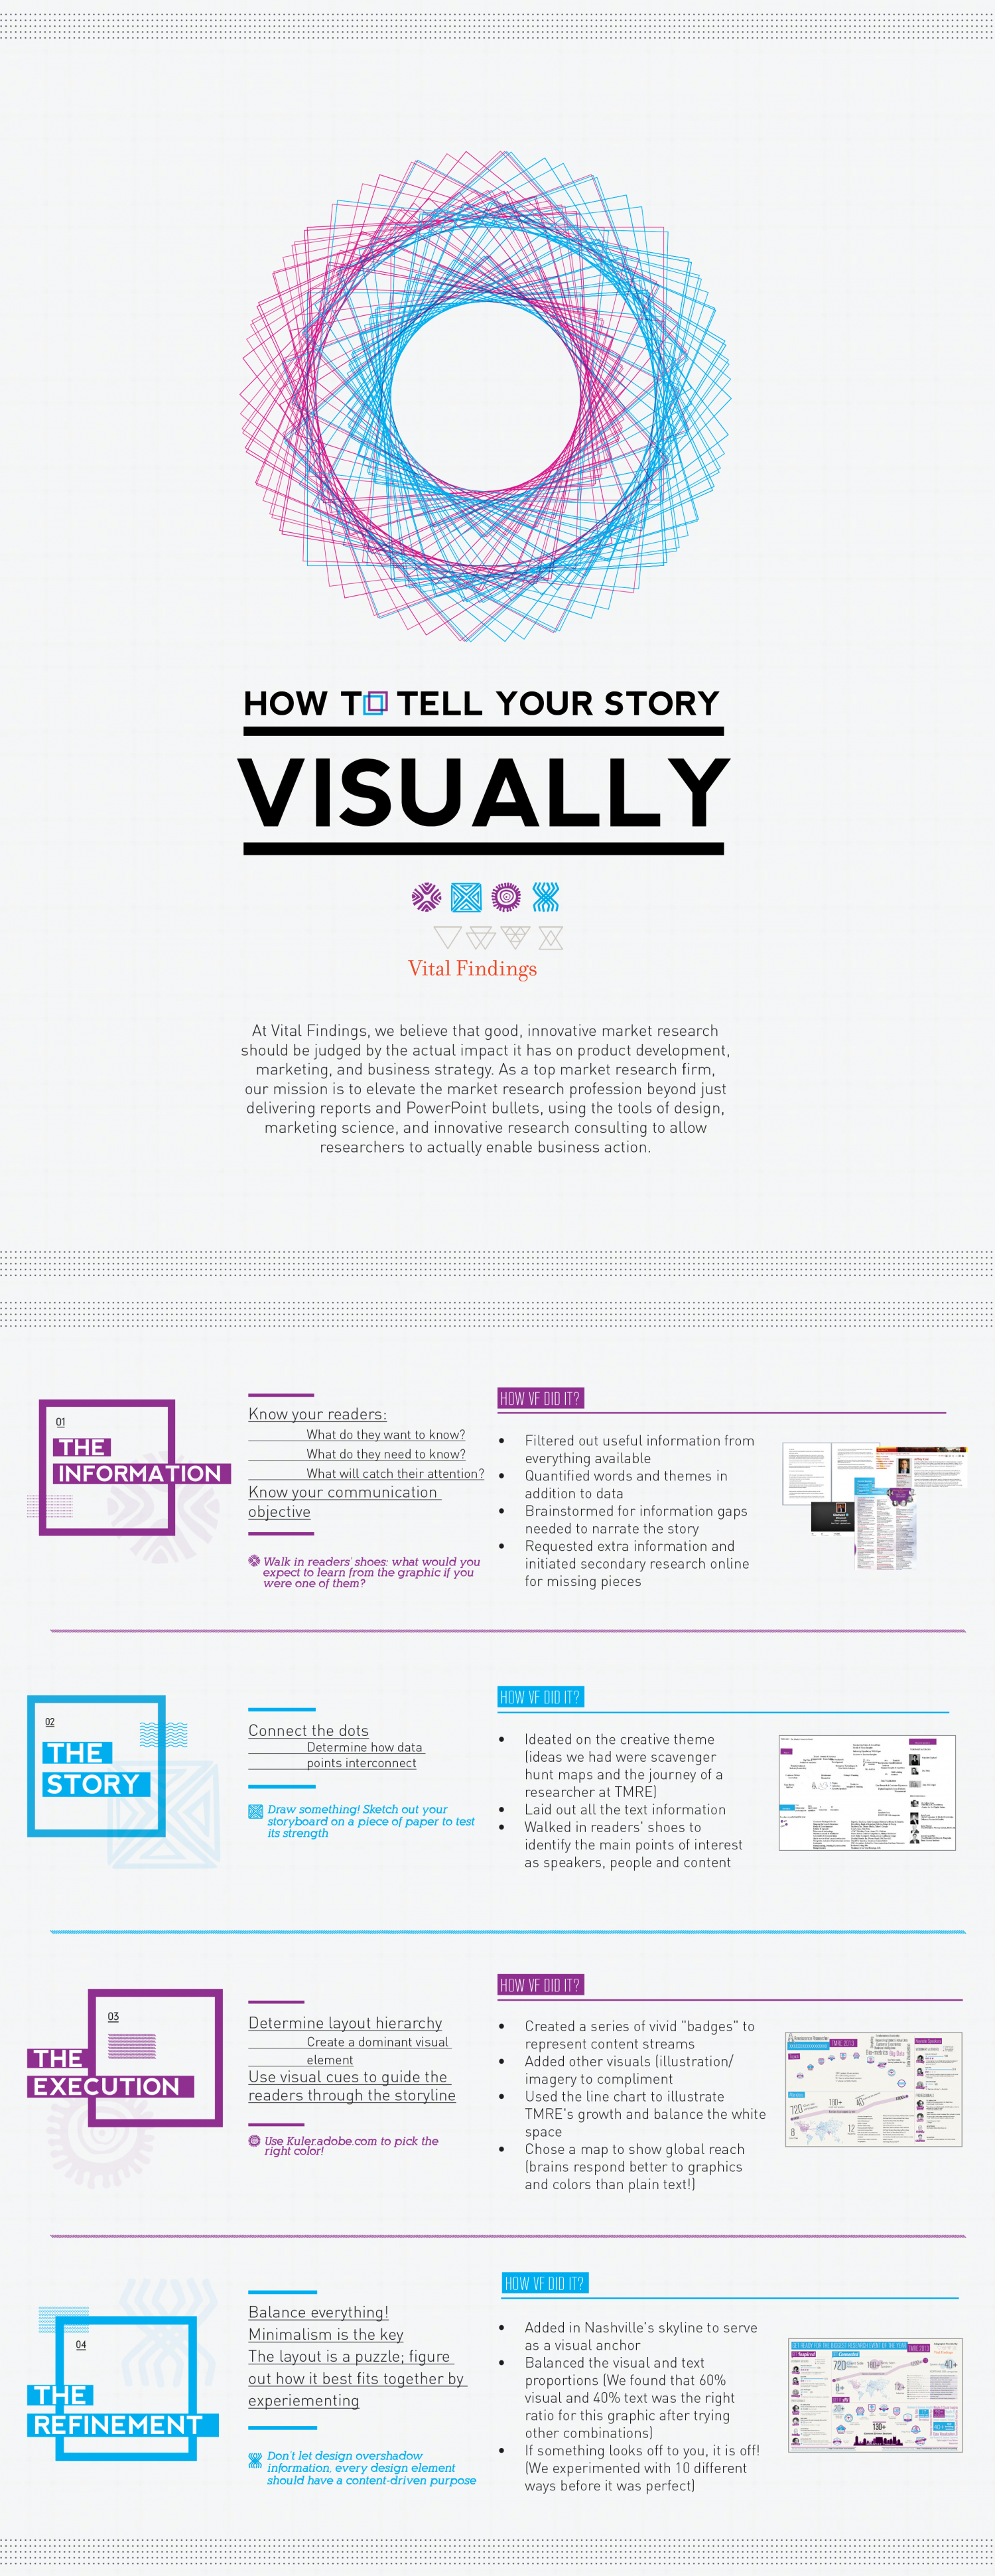
HOW TO TELL YOUR STORY VISUALLY Vital Findings X AAA At Vital Findings, we believe that good, innovative market research should be judged by the actual impact it has on product development, marketing, and business strategy. As a top market research firm, our mission is to elevate the market research profession beyond just delivering reports and PowerPoint bullets, using the tools of design, marketing science, and innovative research consulting to allow researchers to actually enable business action. HOW VF DID IT? Know your readers: 01 What do they want to know? Filtered out useful information from THE INFORMATION What do they need to know? What will catch their attention? everything available Quantified words and themes in Know your communication objective addition to data Brainstormed for information gaps needed to narrate the story Requested extra information and initiated secondary research online for missing pieces Gladwell Gadwel Walk in readers' shoes: what would you expect to learn from the graphic if you were one of them? HOW VF DID IT? 02 Connect the dots Ideated on the creative theme T The THE STORY Determine how data points interconnect Raconciing Scaed Amul Da Suta Soal VAT AUTNORS Ralng kapany Wa R (ideas we had were scavenger Trnd da tndy D mt nd ha Degt Prediw Aly C m epambaim hunt maps and the journey of a researcher at TMRE) Redha Laid out all the text information Draw something! Sketch out your storyboard on a piece of paper to test its strength Soem to KTUNE SOom rel pen let Cmer Walked in readers' shoes to Da Te Ca Cl Cumy be oder Gala omberg Bk A a D Yng Tbook la Dory Melia Ybol. Google Low a E N ce n en fidsch Pw, Mieck, Cne Corporanon, Phlipe rthe Fend Mi Compe pa lth C identify the main points of interest as speakers, people and content Den Sorne n Malt log e F Lv HOW VF DID IT? 03 Determine layout hierarchy Created a series of vivid "badges" to A Renaissance Researcher Create a dominant visual represent content streams Added other visuals (illustration/ imagery to compliment Used the line chart to illustrate Feconcing Statat 6 Achal arta S Customer Experkence Bass intelligo Bio-metrics Big Data TMRE 2013 Keynote Speakers XXXXXXXXXXXXXXXXXX THE EXECUTION VISIONARY AUTHORS element Use visual cues to guide the readers through the storyline 0 t dnen Attendees PROFESSIONALS 1200.e 180+ 720 TMRE's growth and balance the white parciapt Nate dpatpats b es 12 8. space Chose a map to show global reach (brains respond better to graphics and colors than plain text!) Use Kuler.adobe.com to pick the right color! HOW VF DID IT? Balance everything! Minimalism is the key The layout is a puzzle; figure out how it best fits together by Added in Nashville's skyline to serve 04 as a visual anchor GET READY FOR THE BIGGEST RESEARCH EVENT OF THE YEAR TMRE 2013 V Infagrephe Previdedb Vital Findinge GET Inspired GET Connecled Balanced the visual and text 720 180+rely Seen Speakers 40+ Client Side 1200+ FORTUNE S00 companies proportions (We found that 60% visual and 40% text was the right ratio for this graphic after trying other combinations) If something looks off to you, it is off! (We experimented with 10 different ways before it was perfect) THE REFINEMENT 8+ 12+ experiementing GET IT ALL PROFESSIONALS 20+ oBines ghts Mobile 6 Sociel Insights 17 90+ Youth 6 130+ 40+ Data Visualization Content Driven Sessions NASVILLE Don't let design overshadow information, every design element should have a content-driven purpose
How to Tell Your Story Visually
Designer
Chen YaoSource
http://Category
How ToGet a Quote
You may also like...


