Transcribed
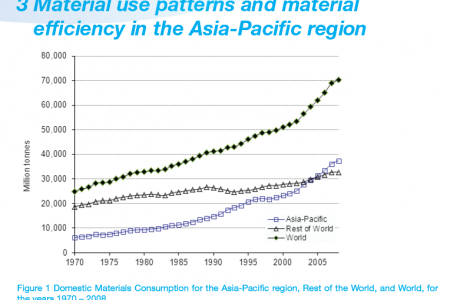
Domestic materials consumption per capita for the Asia-Pacific region, Rest of the World, and World, for the years 1970 – 2008.
14 12 10 8 6 4 Asia-Pacific +Rest of World World 2 1970 1975 1980 1985 1990 1995 2000 2005 Figure 2 Domestic materials consumption per capita for the Asia-Pacific region, Rest of the World, and World, for the years 1970 – 2008. tonnes/Capita
Domestic materials consumption per capita for the Asia-Pacific region, Rest of the World, and World, for the years 1970 – 2008.
shared by W.E.R.I on Jul 14
114
views
0
faves
0
comments
Figure 2 shows a convergence of per capita DMC between the Asia-Pacific and the rest of the World.
While per capita DMC for ROW remained almost static over the entire period 1970-2008, it increased
by...
a compounding rate of 3.1% p.a. in the Asia Pacific region, accelerating to nearly 4.4% for the
final decade of that period.
At the outset of the GFC, per capita DMC declined slightly in the ROW, but continued to grow in the
Asia-Pacific, albeit at a reduced rate. Taking into account the effect the GFC had on World growth,
and the fact that this only caused a modest slowing in the rate of per capita DMC growth in the
region, two points raised in the REEO AP report (UNEP 2011) are reinforced: there is little evidence
for a tendency towards dematerialization of growth in the Asia-Pacific region, and the underlying rate
at which per capita DMC is growing may in fact be continuing to accelerate. Confirmation of this later
point will require a longer time series extending across the period from 2008 onwards, however it
appears possible from the trends revealed in Figure 2 that a cross over point, where the Asia-Pacific’s
per capita DMC exceeds that of ROW, may already have been reached sometime after 2008.
Source
Unknown. Add a sourceCategory
EconomyGet a Quote