Death and Taxes 2014: US Federal Budget
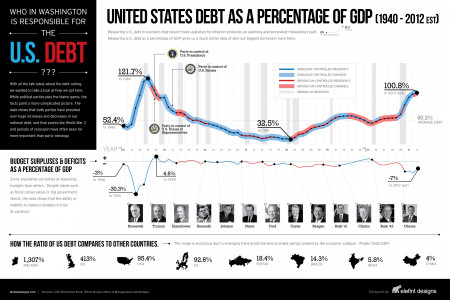
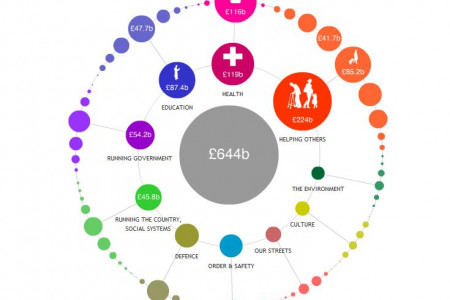
Death&Taxes United States 2014 Federal Budget A Visual Guide to Where Your Federal Tax Dollars Go National Debt 13,296 Trillion +7% +229% Executive Office of the President 0.401 Billion +0.5% -98% Department of Commerce 8.601 Billion +3% +49% Student Aid Administration 1.053 Billion +800% +0.4% Atomic Energy Defense Activities 17.833 Billion +3% -11% Procurement 34.262 Billion +1% Office of Administration 0.113 Billion -1% Office of Management and Budget 0.093 Billion +3% +39% National Oceanic and Atmospheric Administration 5.447 Billion +4% +48% Accelerating Achievement and Ensuring Equity 14.843 Billion -5% +7% How to Read the Data OF DEFE Weapons Activities 7.868 Billion +4% +27% NASA 17.716 Billion -0.1% +15% Classified Programs 14.519 Billion +1% Each item in this chart is packed with data. The chart works in this way: O The White House 0.056 Billion -2% -70% Student Financial Assistance 24.685 Billion +0% +76% PARTMEN Subsistence 1.134 Billion -2% Judicial Branch 6.735 Billion +2.57% +39.24% Special Education 11.816 Billion -7% +3% Science 5.018 Billion -2% F-35 3.425 Billion +0.2% Defense Environmental Cleanup 5.317 Billion +6% -5% NORA Legislative Branch 4.638 Billion +5% +30% Percent change from 2013 to 2014. Red numbers indicate a decrease; green numbers indicate an increase. The program or Travel 1.263 Billion -2% Courts of Appeals and District Courts 6.47 Billion +2.57% +39.74% Discretionary budget authority for 2014. Evolved Expendable Launch Vehicle (Space) 1.853 Billion +10% NASA item name. - Exploration 3.916 Billion +3% Training and Support 1.759 Billion +1% House of Representatives 1.233 Billion +0% +23% Bureau of the Census 0.983 Billion +10% +61% Innovation and Instructional Teams 5.335 Billion +247% +384% Naval Reactors 1.246 Billion +15% +64% National Guard 3.178 Billion +2% Science 5.153 Billion +5% +46% Senate 0.892 Billion +2% +25% National Institute of Standards and Technology 0.934 Billion +22% +54% - Other Production Charges 1.242 Billion +47% Basic Energy 1.862 Billion +8% Space Operations 3.883 Billion -9% -48% International Trade Administration 0.52 Billion +14% +55% Education Improvement Programs 2.757 Billion -39% -55% - High Energy Physics 0.777 Billion -2% 3- Biological and Environmental Research 0.625 Billion +2% Supreme Court 0.085 Billion +4.94% +7,59% HArchitect of the Capitol 0.669 Billion +20% +65% FOF ENERCE Officer Pay 9.311 Billion +2% - Economic Development Administration 0.321 Billion +24% +4% Cross-Agency Support 2.85 Billion -5% C-5M 1.022 Billion +8% Forest Service 4.841 Billion -5% -6% Library of Congress 0.608 Billion +3% +16% Supporting Student Success 1,832 Billion +610% +114% PARTMENT Space Technology 0.743 Billion +28% Aeronautics 0.566 Billion -1% Procurement 38.941 Billion +13% Nuclear Physics 0.57 Billion +3.4 % Advanced Computing Research 0.466 Billion +5% - Energy Conservation 1.878 Billion +100% - C-130J 0.700 Billion +491% Government Accountability Office 0.524 Billion +2% +14% Corps of Engineers 4.73 Billion -54% +4% Career, Technical, and Adult Education 1.75 Billion +0.4% -17% Virginia Class Submarine 5.285 Billion +29% O- Capitol Police 0.363 Billion +6% +65% - Impact Aid 1.224 Billion -6% -0.5% TED STATES OF AME SBIR High (Space) 0.583 Billion -38% Operations 1.75 Billion -28% +32% Department of the Treasury 13.315 Billion +7% +19% The size (area) of the circle is in proportion to the department's funding level. Percent change from 2004 to 2014. This percent is indicated in gray, regardless of decrease or increase. If it is missing, the program did not exist, was merged or renamed, or could not be found in the 2004 data. P-8A Poseidon 3.503 Billion +28% Elementary and Secondary Education 41.195 Billion +6% -26% Congressional Budget Office 0.046 Billion +4% +35% Energy Supply 3.103 Billion -8% +162% Energy Efficiency and Renewable Energy 1.104 Billion +24% Enlisted Pay 17.028 Billion +2%- Y Construction 1.12 Billion -78% -30% Internal Revenue Service 12.944 Billion +7% +27% MC-130J 0.493 Billion +19% Personnel 31.813 Billion +2% DDG-51 2.004 Billion -43% Department of Education 71.211 Billion +4% +28% Enforcement 5.662 Billion +6% +40% UNITED STATES OF AMERICA Harbor Maintenance 0.89 Billion +1% +41% GPS III Space Segment 0.478 Billion -3.11% Department of Agriculture 21.483 Billion -7% +1% Solar Energy 0.357 Billion -6% EA-18G 2.002 Billion +90% Mississippi River and Tributaries 0.27 Billion +8% -16% 0Vehicle Technology 03 Billion +22% Biomass and Biorefinery 0.282 Billion +2% - Higher Education 28.359 Billion +1% +71% AC-130J 0.470 Billion NEW Folisted Pay 17.864 Billion +4% Food and Nutrition Service 7.501 Billion +6% +53% Personnel 35.044 Billion +2% Operations and Maintenance 47.457 Billion +5% CVN Refueling Overhauls 1.951 Billion +16% B-2 Defensive Management System 0.304 Billion +8% F-22A Squadrons 0.329 Billion -12% Space-Based Infrared System (SBIRS) High EMD 0.353 Billion -21% Defense Research Sciences 0.373 Billion +3% Nuclear Energy 0.635 Billion -18% Uranium Enrichment Decommissioning 0.555 Billion +17% +34% Air Operations 17.301 Billion +11% H Forest Service 4.841 Billion -5% -6% Operations Support 4.569 Billion +11% +179% - Howard University 0.234 Billion -0.4% -2% Officer Pay 7.81 Billion +0.72%, Littoral Combat Ship 1.793 Billion +0,45% Air Force 144.43 Billion +3.33% - Gallaudet University 0.118 Billion -6% +18% Fossil Energy Research 0.421 Billion -15% -36% Taxpayer Services 2.412 Billion +7% -41% Administration 7.104 Billion -1% A- Farm Service Agency 1.648 Billion -1% +10% V-22 (Medium Lift) 1.488 Billion +2% Advanced Research 0,379 Billion +36% Fiscal Service 0.36 Billion -8% -10% Long Range Strike 0.379 Billion +30% Classified Programs 1.228 Billion +1% Department of Transportation? 16.297 Billion -40% +17% GPSIII 0.384 Billion +3% e - National Institute of Food and Agriculture 1.293 Billion +7% +15% Department of Energy 28.415 Billion +5% +41% Financial Crimes Enforcement Network 0.104 Billion -6% +80% - Logistics 1.104 Billion +7% Reserve 1.89 Billion -0.35% JSF STOVL 1.370 Billion -9% e Federal Railroad Administration 022 Billion -34% -84% CSAR HH-60 Recapitalization 0.394 Billion +219% Department of Justice 16.338 Billion -9% -17% AIR THE OF Environmental Protection Agency 8.152 Billion -9% -3% Space Situation Awareness Systems 0.400 Billion +50% Subsistence 1.204 Billion +2% E-2D Adv Hawkeye 1.264 Billion +28% Rural Housing Service 1.55 Billion +19% +13% Pipeline and Hazardous Materials Safety Administration 0.228 Billion +31% +103% Federal Bureau of Investigation 8.293 Billion +2% +81% - National Guard 6.566 Billion +9% Test and Evaluation Support 0.743 Billion +3% HMaritime Administration 0.365 Billion +4% +66% Completion of PY Shipbuilding Programs 1.252 Billion +136% Clean and Safe Water 4.246 Billion -1% Counterterrorism 3.171 Billion +6% FOCE RESIANCHAND IENTO F-35 - EMD 0.816 Billion -33% Travel 0.957 Billion -2% Agricultural Research 1.279 Billion +16% +11% Federal Transit Administration 2.315 Billion -82% +59% JSF CV 1.230 Billion +15% - Land Preservation and Restoration 2.021 Billion -7% Criminal Enterprises and Federal Crimes 2.519 Billion +3% KC-46 1.559 Billion -14% - Mobilization 4.594 Billion +4% Training and Recruiting 3.606 Billion -4% Flight Training 0.792 Billion +6% Specialized Skill Training 0.399 Billion -17% Recruiting and Advertising 0.123 Billion -6% Spares and Repair Parts 1.142 Billion -2% Federal Aviation Administration 12.201 Billion -4% +17% RDT&E 25.703 Billion +4% Classified Programs 11.875 Billion +6% Clean Air and Global Climate Change 1.008 Billion +0.3% HFederal Prison System 6.909 Billion +4% +45% - Facilities and Equipment Trust Fund 2.778 Billion +0.04% -3% Compliance and Environmental Stewardship 0.784 Billion +1% RDT&E 16.030 Billion -5% Drug Enforcement Administration 2.058 Billion +0.4% +25% • UNITEDS US Attorneys 2.37 Billion +2% Marshal Services 1.262 Billion -55% Operations 3.223 Billion -30% +7% Healthy Communities and Ecosystems 0.668 Billion +2% Reserve 3.164 Billion -0.06% Classified Programs 1.185 Billion +3% MCM XLVI STATES Navy 155.79 Billion -1.96% Combat Related Operations 2.551 Billion -2% Joint Strike Fighter USF) - EMD 1.047 Billion -30% OF LTrust Fund Share of FAA Activities 6.484 Billion +27% +45% Bureau of Alcohol, Tobacco, Firearms, and Explosives 1.217 Billion +5% +47% COCOM 1.378 Billion +27% Advanced Submarine System Development 0.853 Billion +54% DE PARTMENT ANTED SINTES Space Operations 0.739 Billion -8% United States 2014 National Intelligence Program 48.2 Billion -8% - OF Chalk Eagle 0.519 Billion +2% Food 0.883 Billion +2% CH-53K 0.503 Billion -17% Federal Budget' Drugs 0.466 Billion -3% OF Health Resources and Services Administration 6.034 Billion -4% -10% TED STATES TE OF NAVA Defense Research Sciences 0,484 Billion +2% Food and Drug Administration 2.558 Billion +1% +88% O- HIV/AIDS 2.387 Billion +2% C- Advanced Nuclear Power Systems 0.429 Billion +72% Littoral Combat Ship (LCS) 0.406 Billion -5% 1.156 Trillion Dollars -3.5% +27.68% FDA RESEA Department of Housing and Urban Development 33.119 Billion -34% +3% OF HOUS -Health Centers 1.472 Billion -1% RQ-4 UAV 0.375 Billion -43% Administration for Children and Families 17.767 Billion +6% +34% - This chart depicts the President's budget request for 2014. The center circle is the size of the discretionary part of that budget, and the smaller circles represent the details of the spending. Military Intelligence Program 14.6 Billion -7% Test and Evaluation Support 0.331 Billion -3% DEPARTMENT National Institute of Child Health and Human Development 1,339 Billion +1% Centers for Disease Control and Prevention 5.293 Billion -8% +15% Multi-mission Maritime Aircraft (MMA) 0.317 Billion -25% - Tenant-based Rental Assistance 19.996 Billion +5% National Institute of Mental Health 1.466 Billion -2% SERVICES Intelligence Budget 62.8 Billion -7% National Institute of Neurological Disorders and Stroke 1.643 Billion +0.4% USA Public Health Preparedness and Response 1.334 Billion +2% Retract Maple 0.308 Billion -10% Unlike Social Security, Medicare, and Medicaid, which are mandatory spending, the discretionary budget reveals specific details about our national priorities. NO URBAN CDC OF Advanced Above Water Sensors 0.276 Billion +8% National Institute of Diabetes and Digestive and Kidney Disease 1.812 Billion +0.2% NIDOK HIV/AIDS, Viral Hepatitis, STD and TB Prevention 1.177 Billion +6% Next Generation Jammer (NGJ) 0.258 Billion +38% Project-based Rental Assistance 10.278 Billion +9% DEVELOPM National Institute of General Medical Sciences 2.401 Billion -3% Chronic Disease Prevention and Health Promotion 1.036 Billion +36% ONAL We have placed national security-related funding primarily on the left side of the chart; the right side represents other expenditures. For reference, the entire federal budget, both mandatory and discretionary, is depicted in the inset in the bottom-right corner. Public Housing Operating Fund 4.56 Billion +14% +27% National Heart, Lung, and Blood Institute 3.099 Billion +0,03%H Indian Health Service 4.43 Billion +2% +52% Operations and Maintenance 41.143 Billion -4% Community Development Fund 3.128 Billion -84% -37% OF Base Operations Support 7.28 Billion -2%n Ship Operations 11.162 Billion -6% Employment and Training Administration 9.4 Billion -5% -2% Substance Abuse and Mental Health 3348 Billion -0.6% +4% Department of Defense 526.6 Billion -0.9% (baseline funding) HEALTH Homeless Assistance Grants 2.381 Billion +24% +89% Public Housing Capital Fund 1.979 Billion +5% -27% Home Investment Partnership Program 0.945 Billion -6% -53% Housing for the Elderly 0.398 Billion +6% -49% National Institute of Allergy and Infectious Diseases 4.579 Billion +1% Force Readiness Operations Support 3.56 Billion +3% Air Operations 8.602 Billion -0,58% National Security Non-National Security DEPARTMENT -Public Health and Social Services Emergency Fund 1.29 Billion +68% Unemployment Trust Fund 4.1 Billion -6% +9% AMERICA OF National Cancer Institute 5.126 Billion +0.5% K 647 Billion 509 Billion Overseas Contingency Operations 88.5 Billion +1.5% (Formerly known as Global War on Terror) Base Support 7,469 Billion -7% - Training and Employment Services 3.4 Billion +5% -34% 56% 44% Facilities Sustainment, Restoration, & Modenization National Institutes of Health 31,173 Billion +1% +12% Department of Health and Human Services 78.251 Billion +7% +13% Office of Job Corps 1.692 Billion -19% Occupational Safety and Health Administration 0.571 Billion +0.4 % +25% - Bureau of Labor Statistics 0.547 Billion +0.4% +23% Mine Safety and Health Administration 0.381 Billion +1% +42% - Wage and Hour Division 0.243 Billion +6% Employee Benefits Security Administration 0.18 Billion -2% +45% Administration 4.899 Billion +6% 2.75 Billion -9% Total Department of Defense 615.1 Billion +1.5% Operating Forces 21 Billion -6% Acquisition and Program Management 1.140 Billion +4% Department of the Interior 11.743 Billion -4% +9% STATES Classified Programs 0.546 Billion +2% National Park Service 2.636 Billion -12% +13% - Naval Investigative Service 0.543 Billion -6% Operations and Maintenance 45.531 Billion -4% Total Budget Bureau of Indian Affairs 2.562 Billion +0.6% +9% Combat Operations/Support 3.15 Billion +3% Department of Labor 12.127 Billion +1% +6% Customs and Border Protection 11.231 Billion +10% +124% This bar graph depicts expected revenue (left bar) and total spending (right bar) for the proposed Training and Recruiting 8.582 Billion +1% Fish and Wildlife Service 1.553 Billion -0,1% +16% Army 129.67 Billion -2% Weapons Support 2.229 Billion +1% Security Between Points of Entry 3.757 Billion +3% 2014 federal budget. The difference between revenue and spending is the budget deficit. RDT&E 8.593 Billion -6% National Science Foundation 7.629 Billion +3% +36% Specialized Skill Training 1.034 Billion -6% – Training and Recruiting 1.798 Billion +5% US Geological Survey 1.167 Billion +9% +24% Border Security Fencing 0.351 Billion -12% 0 Spending Revenue THE Manned Ground Vehicle 0.592 Billion -8% Assembled Chemical Weapons Alternatives 0.584 Billion -7% Amy Integrated Air and Missile Defense (AIAMD) 0.365 Billion +31% Geosciences 1.394 Billion +5% Specialized Skill Training 0.630 Billion +8% Bureau of Land Management 1.161 Billion +2% +14% 3.034 Trillion +12% +61% 3.778 Trillion +3% +65% Flight Training 1.02 Billion -10% Recruiting and Advertising 0.2417 Billion +0.17% Mathematical and Physical Sciences 1.386 Billion +6% Security at Point of Entry 5.023 Billion +15% H Bureau of Reclamation 1.046 Billion -0.5% +11% Recruiting and Advertising 0.486 Billion -4% WELL BEENO Other Independent Agencies 19.683 Billion -6% +28% Naval Reserve 1.198 Billion -4% Computer Science and Engineering 0.95 Billion +10% Army Test Ranges and Facilities 0.341 Billion -8% STATES Marine Corps 24.2 Billion -3% Social, Behavioral, and Economic Sciences 0.272 Billion +7% Office of Governmental Ethics 0.015 Billion -21% +36% Social Security Operating Expenses 6.731 Billion -4% +43% Acquisition, Construction, and Improvements 0.889 Billion -49% -4% National Guard 7.054 Billion -0.8% International and Integrative Activities 0.542 Billion +36% Biological Sciences 0,761 Billion +7% Warfighter Information Network-Tactical - DEM/VAL 0.272 Billion -2% Personnel 13.583 Billion +3% US Institute of Peace 0.036 Billion -8% +112% 866 Billion +6% +75% Individual Income Taxes UNITED Engineering 0.911 Billion +10% DEPARTMENT Procurement 1.344 Billion -14% O Airaraft Modifications/Product Improvement Programs 0.257 Billion -8% - Defense Research Sciences 0.222 Billion +1% Brigade Analysis, Integration, and Evaluation 0.194 Billion -10% US Holocaust Memorial Museum 0.052 Billion +2% +30% 1,383 Billion +12% +71% US Coast Guard 7.995 Billion -13% +36% MENT Administration 4.83 Billion -5% CORPS MARINE Common Computer Resources 0.122 Billion -41% Radar Systems 0.114 Billion -11% Consumer Product Safety Commission 0.117 Billion +2% +95% DEPART Transportation Security Administration 4.837 Billion -12% +58% Servicewide Communications 1.563 Billion +1% H National Defense Corporation for National and Community Service 1.061 Billion -0.1% +13% Smithsonian Institution 1.057 Billion +1% +43% Nuclear Regulatory Commission 0.124 Billion -4% +53% Army Kwajalein Atoll 0.194 Billion +10% Aviation Security 2.722 Billion -14% +48% 627 Billion -5% +38% National Endowment for the Humanities 0.154 Billion +5% +14% Other Service Support 1.212 Billion +5% High Performance Computing Modernization Program 0.181 Billion +0.04% Combat Vehicle Improvement Programs 0.178 Billion -30% OMELAND Operations and Maintenance 6,518 Billion +4% Federal Air Marshals 0.827 Billion -15% +33% 1775 Enlisted Pay 1 8.868 Billion +2% National Endowment for the Arts 0.154 Billion +5% +27% Small Business Administration 0.952 Billion -50% +21% Classified Programs 1.02 Billion -3% Federal Emergency Management Agency 9.586 Billion -57% +34% STATES OF AMERICA Reserve 0.263 Billion -3% Administration 0.483 Billion +3% Training and Recruiting 0.778 Billion +14% Operating Forces 4.994 Billion +3% Income Security Railroad Retirement Board 0.157 Billion -2% -15% Broadcasting Board of Governors 0.732 Billion +2% +24% FEMA Army Reserve 3.10 Billion -2% Electronic Warfare Development 0.165 Billion -15% Social Insurance and Retirement 542 Billion +4% +63% Officer Pay 2.697 Billion +8% Intelligence Community Management Account 0.568 Billion +3% +324% SECURIT Federal Trade Commission 0.184 Billion -0.5% +11% O 1,031 Billion +8% +41% Procurement 17.019 Billion -3% Subsistence 0.735 Billion -0.24% Corporation for Public Broadcasting 0.445 Billion 0% +2% Neighborhood Reinvestment Corporation 0.204 Billion -6% +79% Institute of Museum and Library Services 0.226 Billion -3% -13% Medicare Reserve 0.677 Billion +2% State and Local Programs 2.123 Billion -8% -28% Immigration and Customs Enforcement 4.997 Billion -10% +117% UH-60 Blackhawk M Model (MYP) 1.163 Billion -5% Legal Services Corporation 0.43 Billion +23% +28% District of Columbia 0.408 Billion -4% +9% Equal Employment Opportunity Commission 0.373 Billion +3% +15% 531 Billion +4% +97% Travel 0.511 Billion -0.71 % Corporate Income Taxes General Services Administration 0.249 Billion +0.4% +20% National Labor Relations Board 0.285 Billion +2% +17% Federal Drug Control Programs 0.289 Billion -15% -37% Win-T - Ground Forces Tactical Network 0.973 Billion +10% Defense Contract Audit Agency 0.613 Billion +7% Defense Security Service 0.559 Billion +10% The Joint Staff 0.622 Billion +1% US Secret Service 1.547 Billion -8% +36% Domestic Nuclear Detection Office 0.291 Billion -1% Non-National Security 509 Billion +8% +11% 333 Billion +16% +76% CH-47 Helicopter 0.900 Billion -22% Miscellaneous Receipts* Personnel 56.637 Billion +0.39% National Archives and Records Administration 0.368 Billion -2% +20% Medicaid 249 Billion +11% +37% National Debt Interest 223 Billion +0% +39% Other AH-64 Apache Block IIIA Reman 0.759 Billion +11% Department of Homeland Security 44.67 Billion -22% +47% 287 Billion +20% +116% Commodity Futures Trading Commission 0.315 Billion +52% +254% Postal Service 0.333 Billion -0.6% +455% - Washington Headquarters Services 0.652 Billion +19% Defense Logistics Agency 0.725 Billion -2% Chem Demilitarization - RDT&E 0.604 Billion -7% Budget Deficit 744 Billion -24% +80% Peace Corps 0.379 Billion +1% +23% Department of Veterans Affairs 63.472 Billion +4% +118% Medical Services 46.764 Billion +3% +134% Department of State 51.873 Billion +0.05% +119% Enlisted Pay 24.328 Billion -3% MSE Missile 0.540 Billion +4,105% Nonproliferation, Antiterrorism and Demining 0.616 Billion -14% +66% Millennium Challenge Corporation 0.898 Billion -1% -10% * International Narcotics Control and Law Enforcement 1.474 Billion -28% +189%- Defense Wide 96.756 Billion -0.16% . Defense Security Cooperation Agency 0.806 Billion +44% DEPARTMENT OFSTATE - MQ-1 UAV 0.518 Billion +0.07% OF VETE 231 Billion +28% - Administration of Foreign Affairs 12.018 Billion -1% +72% - Chem Demilitarization - 0&M 0.452 Billion -29% Defense Human Resources Activity 0.830 Billion +17% Mandatory "Miscellaneous Receipts indudes Excise Taxes (105 Billion +23% +50%), Customs Duties (39 Billion +15% +84%), and Estate and Gift Taxes (13 Billion +1% +48%). Discretionary Travel 1.796 Billion +1% Inpatient Care 8.459 Billion +5% Spending = DEPARTMENT Joint Tactical Radio System 0.382 Billion -31% Defense Threat Reduction Agency 0.960 Billion +2% USAID Operating Expenses 1.399 Billion +3% +114% ► 2.62 Trillion 1.16 Trillion Classified 18.656 Billion +2% Officer Pay 12.636 Billion +12% Subsistence 1.963 Billion -7% Stryker Vehicle 0.374 Billion +30% - Defense Contract Management Agency 1.398 Billion +7% International Organizations 1.573 Billion +1% +57% - Global Health Programs 8.315 Billion +1% Counterfire Radars 0.313 Billion +28% Migration and Refugee Assistance 1.761 Billion -7% +125% Long-Term Care 6.415 Billion +15% UNITED STATES OF AMERICA Reserve Component Training and Support 4.565 Billion +1% Chemical Biological Defense Program 1.497 Billion +7% COCOM Combatant Command, GPS Global Positioning System, National Guard 8.041 Billion -0.76% DCGS-A (MIP) 0.267 Billion +45% International Peacekeeping Activities 2.095 Billion +14% +201% Foreign Military Financing Program 5.957 Billion -6% 31% HIV/AIDS Human Immunodeficiency Virus /Acquired Immune Deficiency Syndrome, Paladin Integrated Management (PIM) 0.260 Billion +26% Missile Defense Agency 7.472 Billion +8% Defense Information Systems Agency 1.879 Billion -1% Mental Health Care 5,431 Billion +13% Development Assistance Program 2.798 Billion +10% +108% Economic Support Fund 5.458 Billion -4% +87% JSF Joint Strike Fighter, MSE Missile Segment Enhancement, NASA National Aeronautics Patriot Mods 0.256 Billion +28% US Special Operations Command 7.220 Billion +9% Department of Defense Education Activity 2.715 Billion -1% Information Technology Systems 3.683 Billion +18% Prosthetics Care 2.18 Billion +10% and Space Administration, STD Sexually Transmitted Disease, TB Tuberculosis, DARPA Medical Facilities 4.872 Billion -15% +53% Office of the Secretary of Defense 4.359 Billion +4% Defense Advanced Research Projects Agency 2.865 Billion +2% Medical Support and Compliance 6.033 Billion +3% +50% UAV Unmanned Aerial Vehicle For Comparison Footnotes: 1. A sequester that lowers the discretionary budget cap by $91 billion and direct spending by $18 billion will take effect on Jan. 1, 2014 if Congress does not enact deficit reduction legislation before that time. 2. The total FY 2014 budget for the Department of Transportation is $76.6 billion, a major portion of which is made up of mandatory programs. 3. The US intelligence budget comprises all the funding for the 16 agencies of the US Intelligence Community. Since 2012, the President's aggregate funding request for the intelligence programs has been disclosed, but the agency-level funding remains classified. 4. The FY 2014 request does not yet include a detailed budget for Overseas Contingency Operations (OCO) as of April 2013. A separate OCO budget will be released at a later date. The number used in the poster is an estimate from the Office of the Under Secretary of Defense. NEW refers to new funding for FY 2014. 2012 US Presidential Election Spending | 2.6 Billion GM Bailout Cost (as of December 2012) 50 Billion Bill Gates' Net Worth (as of March 2013) 67 Billion Marshall Plan for Europe (in 2013 dollars) 135 Billion General Notes: All figures are in US dollars. These totals may not add up due to rounding, non-depicted programs with comparatively small budgets, or the presence of offsetting receipts or fees. In this chart, large blue text denotes a major category and smaller blue text denotes a subcategory. This data was obtained from the Office of Management and Budget, or the Office of the Under Secretary of Defense, unless otherwise noted. Data TIMEPLOTS information graphic products US Federal Civilian Employee Salaries (as of Sep. 2012) 161 Billion 2013 Chinese Military Budget 2013 EU Budget 166 Billion in this chart accurately depicts the April 2014 budget request by the President. Circles are sized in proportion to the total budget by area. Images are either in the public domain or are used pursuant to Fair Use under 17 173 Billion USC. 107. Many images are courtesy of www.defense.gov. This poster, or any portion thereof, may not be duplicated without the express written consent of Timeplots, LLC. Please visit www.timeplots.com for sources and more information, or to purchase a copy of the poster. If you have any comments or suggestions for improvement, please email us at [email protected]. US Imported Oil Expenditure in 2012 386 Billion www.timeplots.com FY2014 US Military Budget 626 Billion O 2013 Timeplots, LLC. All Rights Reserved. ANSTINATE EDUCATION & HUMAN ASTITUTER OLUYN TOF DEPART THE NAVY RAIRS AIR FORCE DEPARTA * UNITE DEFENSE RTMENT AMERICA AMERICA NITED STATES OE NERICA DEPARTMENT F DEFENSE ARMY VOIN • UNITED
Death and Taxes 2014: US Federal Budget
Source
http://www.t...oster-2014Category
PoliticsGet a Quote
You may also like...