
Pulse of the Nation
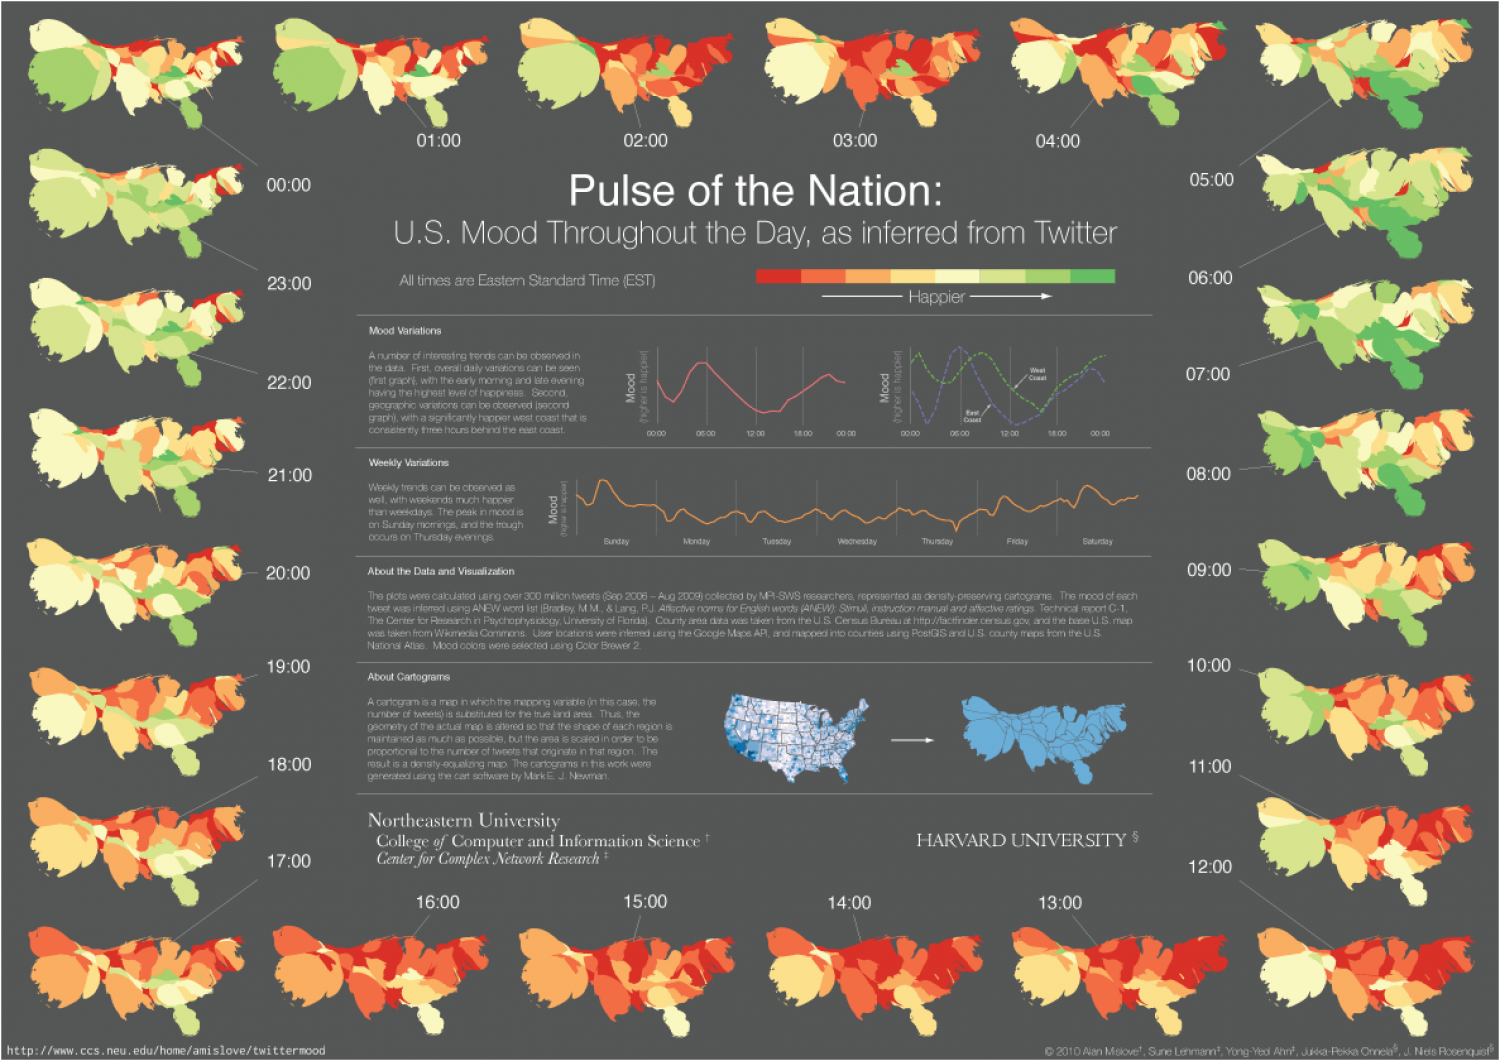
01:00 02:00 03:00 04:00 05:00 Pulse of the Nation: 00:00 U.S. Mood Throughout the Day, as inferred from Twitter 23:00 All times are Eastem Standard Time (EST) 06:00 Наppier Mood Variations Anumber of interesing tends can be observed in the deta. First, cverall daly variations can be seen Trat grapht, with the early moming and late evening having the highst level of happinsBa. Second, geographic variations can be observed ocond graph), with a signicantly happier west coast that is Corestertly three hours behind the eeet coast. Weat Coast 07:00 22:00 05 00 1.00 D0 00 12 00 1.00 Weekly Variations 21:00 08:00 Weeky trende can be obeenvod en wel, with weekends much hegpier then weeldays The peak in mood is on Surday momings, and the trough occure on Thursday evenings Sunday Monday Tuesday Wodnesday Thursday Frday Saturday 20:00 About the Data and Visualization 09:00 The plots were calculated Leing over 300 milon tweets (Sep 2006 - Aug 2009) oolected by MA-SWS researchers, repreBented as density-preserving cartograma. The mood of eech tweet was inferred using ANEW word ist (Bradey, M.M., & Lang, PJ. Affsctive noms for Engish words (ANEW Sirul, instruction manal ard afective ratings. Technical report C-1, The Center tor Pesaarch in Psychophysiciogy, University of Florida). County area deta was talen tom the U.S Census B.reauat http:/factincier.census gov, ani the bese U.S. mep was taken from Wikimecia Cammans. User locations were interred Leing the Googe Mape AP, and mappedi into ccurties Leing PostGS andi U.S. county meps trom the U.S. National Atlas. Mocd colora were selected Leing Color Brewer 2. 19:00 10:00 About Cartograms A cartogram is a mep in which the megping variable in this case, the number of twets) is substituted for the true land area. ThIs, the geometry of the actual mep is atered so that the shape of each region is maintained as much as posslble, but the area is scaled in order to be proportionel to the number of tweets that originate in hat region. The resut is a density-equaizing map The cartograms in tis work were gererated ung the cart sotware by Mark E J. Nerwman 18:00 11:00 Northeastern University College of Computer and Information Science t Center for Complex Network Research HARVARD UNIVERSITY 17:00 12:00 16:00 15:00 14:00 13:00 http://www.ccs.neu.edu/home/amislove/twittermood © 2010 Alan Mskove", Sune Lehmarnt, Yong-Yeal Ahni, Juda-Pekka Ornela, J. Nes Posenquist
Pulse of the Nation
Source
Unknown. Add a sourceCategory
Social MediaGet a Quote