
Facebook's untapped potential
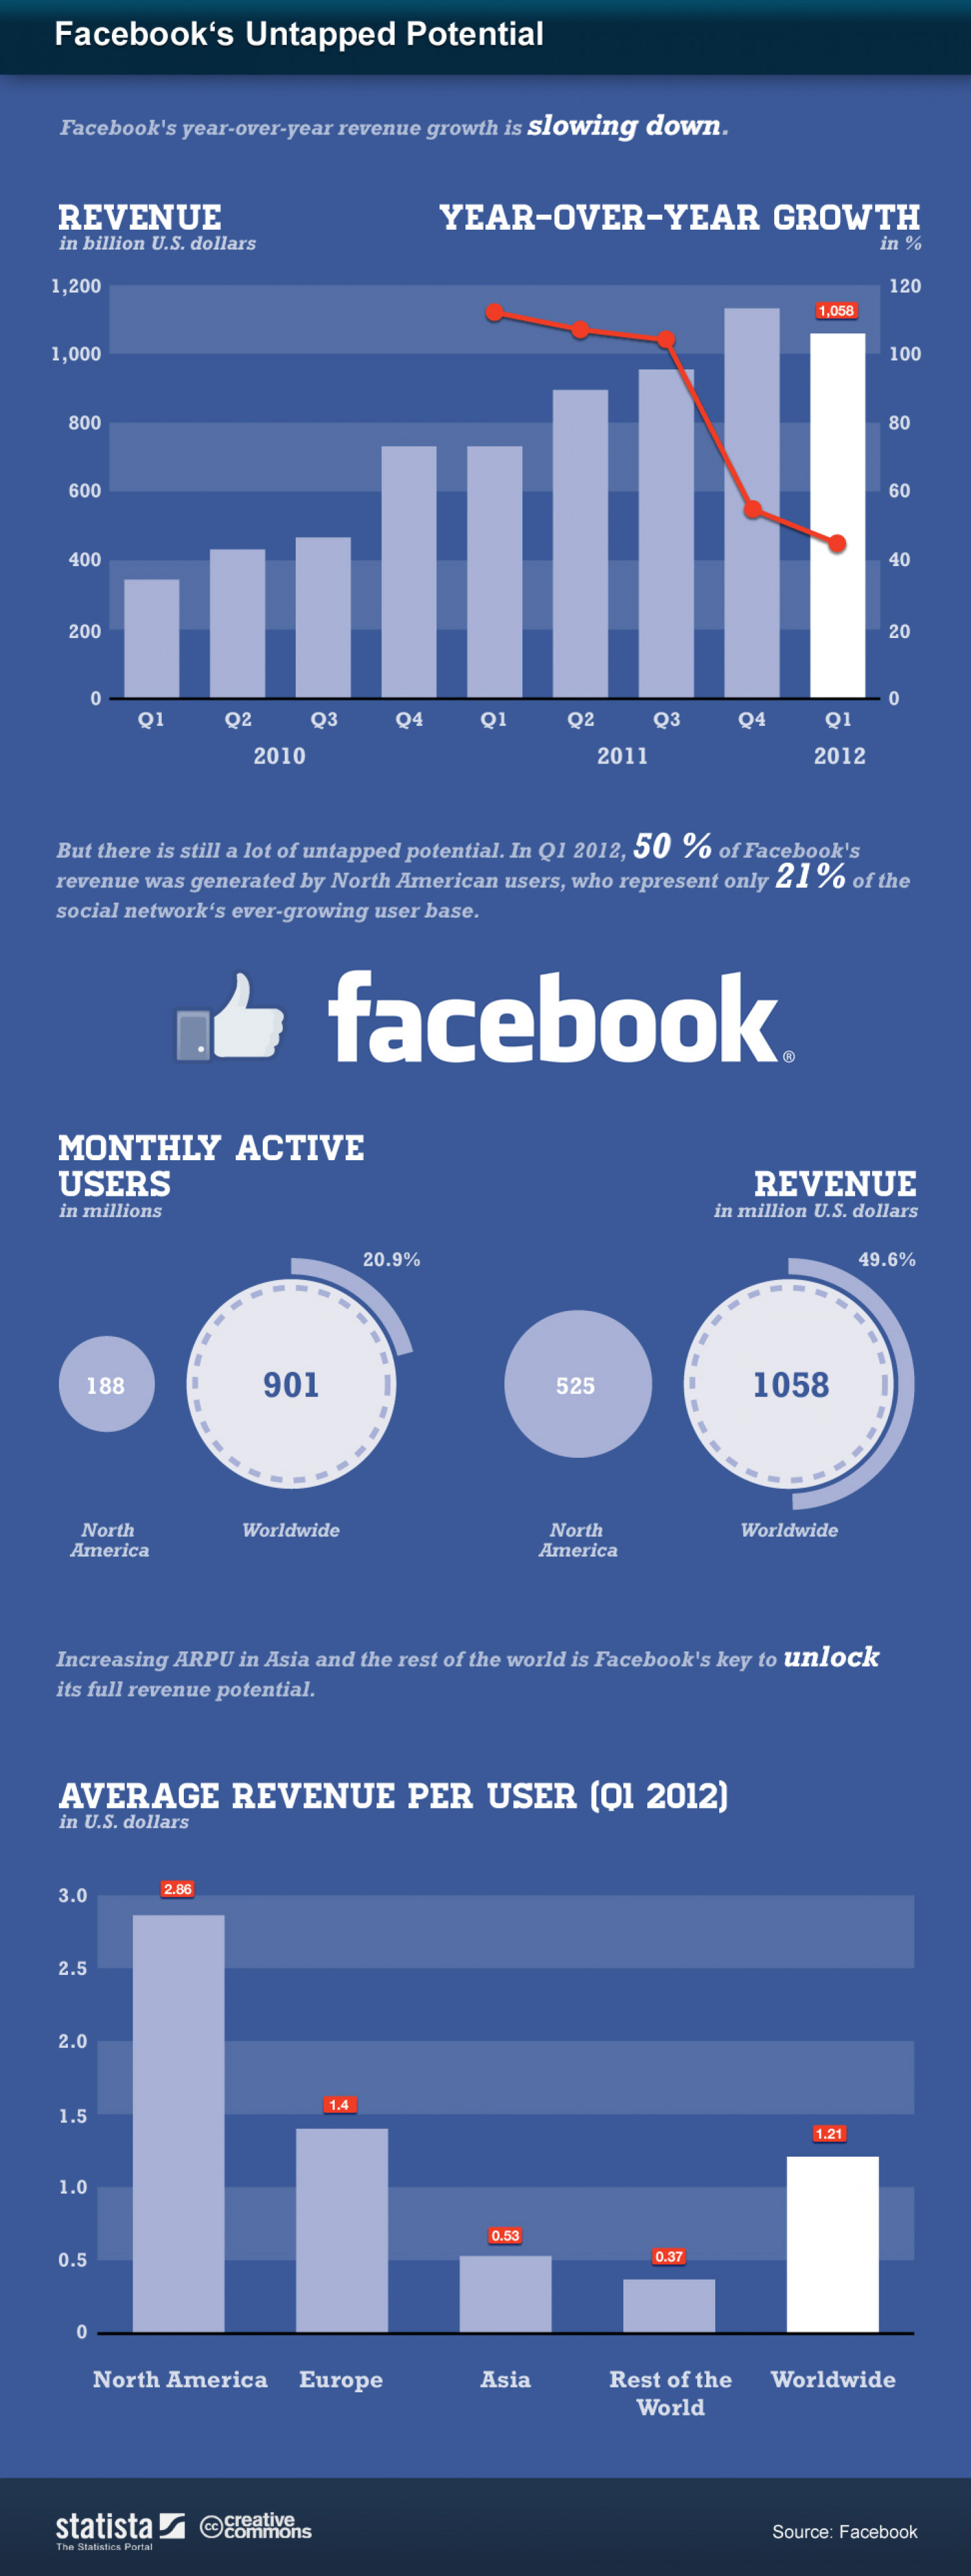
Facebook's Untapped Potential Facebook's year-over-year revenue growth is slowing down. REVENUE in billion U.S. dollars YEAR-OVER-YEAR GROWTH in % 1,200 120 1,058 1,000 100 800 80 600 60 400 200 20 Q1 Q2 Q3 Q4 Q1 Q2 Q3 Q4 Q1 2010 2011 2012 But there is still a lot of untapped potential. In Q1 2012, 50 % of Facebook's revenue was generated by North American users, who represent only 21% of the social network's ever-growing user base. facebook MONTHLY ACTIVE USERS in millions REVENUE in million U.S. dollars 20.9% 49.6% 188 901 525 1058 North America Worldwide North Worldwide America Increasing ARPU in Asia and the rest of the world is Facebook's key to unlock its full revenue potential. AVERAGE REVENUE PER USER (Q1 2012) in U.S. dollars 2.86 3.0 2.5 2.0 1.4 1.5 1.21 1.0 0.53 0.5 0.37 North America Europe Asia Rest of the Worldwide World statista creative commons Source: Facebook The Statistics Portal
Facebook's untapped potential
Publisher
StatistaSource
http://www.statista.comCategory
Social MediaGet a Quote
You may also like...


