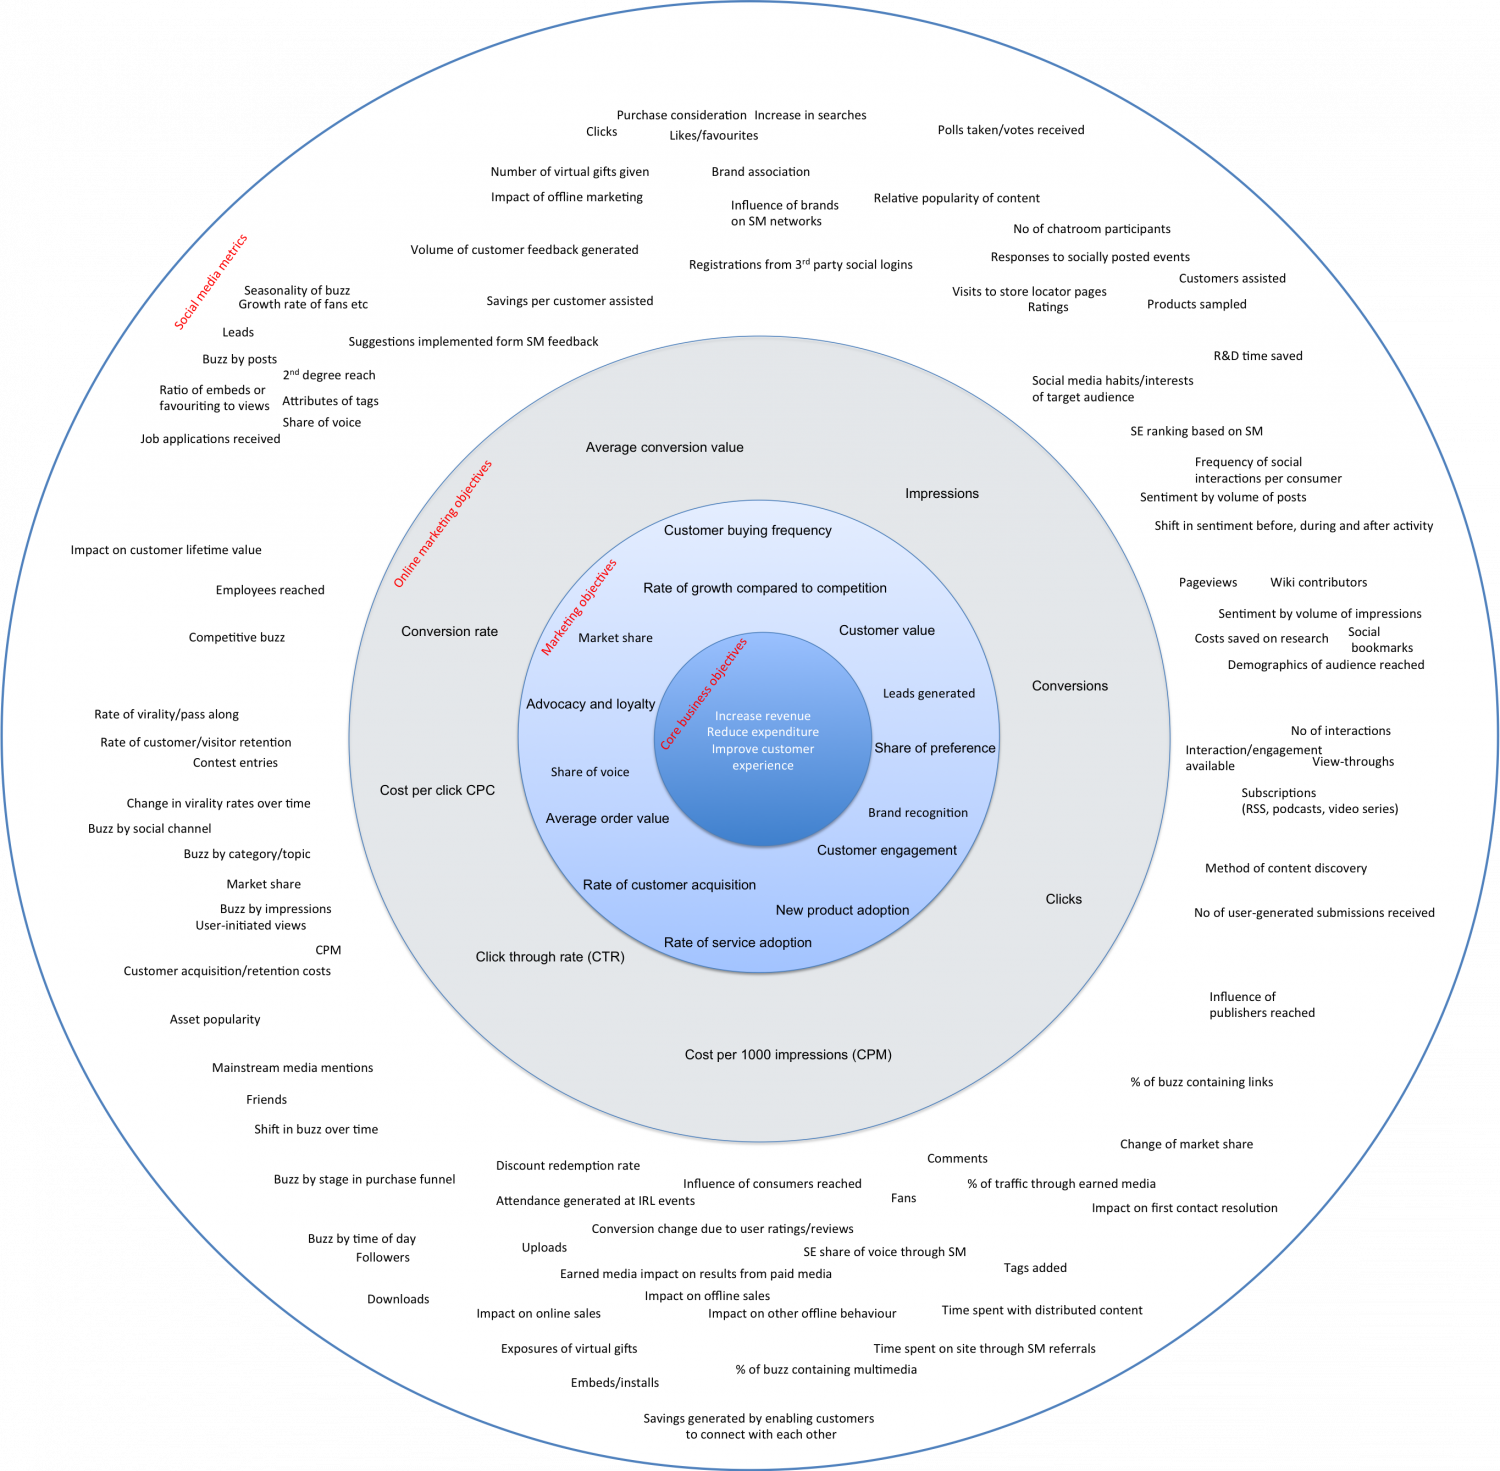
Demonstrate your online marketing ROI (Infographic)
Purchase consideration Increase in searches Clicks Polls taken/votes received Likes/favourites Number of virtual gifts given Brand association Impact of offline marketing Relative popularity of content Influence of brands on SM networks No of chatroom participants Volume of customer feedback generated Responses to socially posted events Registrations from 3rd party social logins Customers assisted Seasonality of buzz Growth rate of fans etc Visits to store locator pages Savings per customer assisted Ratings Products sampled Leads Suggestions implemented form SM feedback Buzz by posts R&D time saved 2nd degree reach Social media habits/interests of target audience Ratio of embeds or Attributes of tags favouriting to views Share of voice SE ranking based on SM Job applications received Average conversion value Frequency of social interactions per consumer Impressions Sentiment by volume of posts Customer buying frequency Shift in sentiment before, during and after activity Impact on customer lifetime value Employees reached Rate of growth compared to competition Pageviews Wiki contributors Sentiment by volume of impressions Conversion rate Customer value Social Competitive buzz Market share Costs saved on research bookmarks Demographics of audience reached Conversions Leads generated Advocacy and loyalty Rate of virality/pass along Increase revenue Reduce expenditure No of interactions Rate of customer/visitor retention Share of preference Improve customer experience Interaction/engagement available Contest entries View-throughs Share of voice Cost per click CPC Subscriptions (RSS, podcasts, video series) Change in virality rates over time Brand recognition Average order value Buzz by social channel Buzz by category/topic Customer engagement Method of content discovery Market share Rate of customer acquisition Clicks Buzz by impressions New product adoption No of user-generated submissions received User-initiated views Rate of service adoption CPM Click through rate (CTR) Customer acquisition/retention costs Influence of Asset popularity publishers reached Cost per 1000 impressions (CPM) Mainstream media mentions % of buzz containing links Friends Shift in buzz over time Change of market share Comments Discount redemption rate Buzz by stage in purchase funnel Influence of consumers reached % of traffic through earned media Attendance generated at IRL events Fans Impact on first contact resolution Conversion change due to user ratings/reviews Buzz by time of day Uploads SE share of voice through SM Followers Earned media impact on results from paid media Tags added Downloads Impact on offline sales Impact on online sales Impact on other offline behaviour Time spent with distributed content Exposures of virtual gifts Time spent on site through SM referrals % of buzz containing multimedia Embeds/installs Savings generated by enabling customers to connect with each other Social media metrics Online marketing objectives Marketing objectives Core business objectives Purchase consideration Increase in searches Clicks Likes/favourites Polls taken/votes received Number of virtual gifts given Brand association Impact of offline marketing Relative popularity of content Influence of brands on SM networks No of chatroom participants Volume of customer feedback generated Responses to socially posted events Registrations from 3rd party social logins Customers assisted Seasonality of buzz Growth rate of fans etc Visits to store locator pages Savings per customer assisted Ratings Products sampled Leads Suggestions implemented form SM feedback Buzz by posts R&D time saved 2nd degree reach Social media habits/interests of target audience Ratio of embeds or Attributes of tags favouriting to views Share of voice SE ranking based on SM Job applications received Average conversion value Frequency of social interactions per consumer Impressions Sentiment by volume of posts Customer buying frequency Shift in sentiment before, during and after activity Impact on customer lifetime value Employees reached Rate of growth compared to competition Pageviews Wiki contributors Sentiment by volume of impressions Conversion rate Customer value Social Competitive buzz Market share Costs saved on research bookmarks Demographics of audience reached Conversions Leads generated Advocacy and loyalty Rate of virality/pass along Increase revenue Reduce expenditure No of interactions Rate of customer/visitor retention Share of preference Improve customer experience Interaction/engagement available Contest entries View-throughs Share of voice Cost per click CPC Subscriptions (RSS, podcasts, video series) Change in virality rates over time Brand recognition Average order value Buzz by social channel Buzz by category/topic Customer engagement Method of content discovery Market share Rate of customer acquisition Clicks Buzz by impressions New product adoption No of user-generated submissions received User-initiated views Rate of service adoption CPM Click through rate (CTR) Customer acquisition/retention costs Influence of publishers reached Asset popularity Cost per 1000 impressions (CPM) Mainstream media mentions % of buzz containing links Friends Shift in buzz over time Change of market share Comments Discount redemption rate Buzz by stage in purchase funnel Influence of consumers reached % of traffic through earned media Attendance generated at IRL events Fans Impact on first contact resolution Conversion change due to user ratings/reviews Buzz by time of day Uploads SE share of voice through SM Followers Earned media impact on results from paid media Tags added Downloads Impact on offline sales Impact on online sales Impact on other offline behaviour Time spent with distributed content Exposures of virtual gifts Time spent on site through SM referrals % of buzz containing multimedia Embeds/installs Savings generated by enabling customers to connect with each other Social media metrics Online marketing objectives Marketing objectives Core business objectives Purchase consideration Increase in searches Clicks Likes/favourites Polls taken/votes received Number of virtual gifts given Brand association Impact of offline marketing Relative popularity of content Influence of brands on SM networks No of chatroom participants Volume of customer feedback generated Responses to socially posted events Registrations from 3rd party social logins Customers assisted Seasonality of buzz Growth rate of fans etc Visits to store locator pages Savings per customer assisted Ratings Products sampled Leads Suggestions implemented form SM feedback Buzz by posts R&D time saved 2nd degree reach Social media habits/interests of target audience Ratio of embeds or Attributes of tags favouriting to views Share of voice SE ranking based on SM Job applications received Average conversion value Frequency of social interactions per consumer Impressions Sentiment by volume of posts Customer buying frequency Shift in sentiment before, during and after activity Impact on customer lifetime value Employees reached Rate of growth compared to competition Pageviews Wiki contributors Sentiment by volume of impressions Conversion rate Customer value Social Competitive buzz Market share Costs saved on research bookmarks Demographics of audience reached Conversions Leads generated Advocacy and loyalty Rate of virality/pass along Increase revenue Reduce expenditure No of interactions Rate of customer/visitor retention Share of preference Improve customer experience Interaction/engagement available Contest entries View-throughs Share of voice Cost per click CPC Subscriptions (RSS, podcasts, video series) Change in virality rates over time Brand recognition Average order value Buzz by social channel Buzz by category/topic Customer engagement Method of content discovery Market share Rate of customer acquisition Clicks Buzz by impressions New product adoption No of user-generated submissions received User-initiated views Rate of service adoption CPM Click through rate (CTR) Customer acquisition/retention costs Influence of publishers reached Asset popularity Cost per 1000 impressions (CPM) Mainstream media mentions % of buzz containing links Friends Shift in buzz over time Change of market share Comments Discount redemption rate Buzz by stage in purchase funnel Influence of consumers reached % of traffic through earned media Attendance generated at IRL events Fans Impact on first contact resolution Conversion change due to user ratings/reviews Buzz by time of day Uploads SE share of voice through SM Followers Earned media impact on results from paid media Tags added Downloads Impact on offline sales Impact on online sales Impact on other offline behaviour Time spent with distributed content Exposures of virtual gifts Time spent on site through SM referrals % of buzz containing multimedia Embeds/installs Savings generated by enabling customers to connect with each other Social media metrics Online marketing objectives Marketing objectives Core business objectives Purchase consideration Increase in searches Clicks Likes/favourites Polls taken/votes received Number of virtual gifts given Brand association Impact of offline marketing Relative popularity of content Influence of brands on SM networks No of chatroom participants Volume of customer feedback generated Responses to socially posted events Registrations from 3rd party social logins Customers assisted Seasonality of buzz Growth rate of fans etc Visits to store locator pages Savings per customer assisted Ratings Products sampled Leads Suggestions implemented form SM feedback Buzz by posts R&D time saved 2nd degree reach Social media habits/interests of target audience Ratio of embeds or Attributes of tags favouriting to views Share of voice SE ranking based on SM Job applications received Average conversion value Frequency of social interactions per consumer Impressions Sentiment by volume of posts Customer buying frequency Shift in sentiment before, during and after activity Impact on customer lifetime value Employees reached Rate of growth compared to competition Pageviews Wiki contributors Sentiment by volume of impressions Conversion rate Customer value Social Competitive buzz Market share Costs saved on research bookmarks Demographics of audience reached Conversions Leads generated Advocacy and loyalty Rate of virality/pass along Increase revenue Reduce expenditure No of interactions Rate of customer/visitor retention Share of preference Improve customer experience Interaction/engagement available Contest entries View-throughs Share of voice Cost per click CPC Subscriptions (RSS, podcasts, video series) Change in virality rates over time Brand recognition Average order value Buzz by social channel Buzz by category/topic Customer engagement Method of content discovery Market share Rate of customer acquisition Clicks Buzz by impressions New product adoption No of user-generated submissions received User-initiated views Rate of service adoption CPM Click through rate (CTR) Customer acquisition/retention costs Influence of publishers reached Asset popularity Cost per 1000 impressions (CPM) Mainstream media mentions % of buzz containing links Friends Shift in buzz over time Change of market share Comments Discount redemption rate Buzz by stage in purchase funnel Influence of consumers reached % of traffic through earned media Attendance generated at IRL events Fans Impact on first contact resolution Conversion change due to user ratings/reviews Buzz by time of day Uploads SE share of voice through SM Followers Earned media impact on results from paid media Tags added Downloads Impact on offline sales Impact on online sales Impact on other offline behaviour Time spent with distributed content Exposures of virtual gifts Time spent on site through SM referrals % of buzz containing multimedia Embeds/installs Savings generated by enabling customers to connect with each other Social media metrics Online marketing objectives Marketing objectives Core business objectives Purchase consideration Increase in searches Clicks Likes/favourites Polls taken/votes received Number of virtual gifts given Brand association Impact of offline marketing Relative popularity of content Influence of brands on SM networks No of chatroom participants Volume of customer feedback generated Responses to socially posted events Registrations from 3rd party social logins Customers assisted Seasonality of buzz Growth rate of fans etc Visits to store locator pages Savings per customer assisted Ratings Products sampled Leads Suggestions implemented form SM feedback Buzz by posts R&D time saved 2nd degree reach Social media habits/interests of target audience Ratio of embeds or Attributes of tags favouriting to views Share of voice SE ranking based on SM Job applications received Average conversion value Frequency of social interactions per consumer Impressions Sentiment by volume of posts Customer buying frequency Shift in sentiment before, during and after activity Impact on customer lifetime value Employees reached Rate of growth compared to competition Pageviews Wiki contributors Sentiment by volume of impressions Conversion rate Customer value Social Competitive buzz Market share Costs saved on research bookmarks Demographics of audience reached Conversions Leads generated Advocacy and loyalty Rate of virality/pass along Increase revenue Reduce expenditure No of interactions Rate of customer/visitor retention Share of preference Improve customer experience Interaction/engagement available Contest entries View-throughs Share of voice Cost per click CPC Subscriptions (RSS, podcasts, video series) Change in virality rates over time Brand recognition Average order value Buzz by social channel Buzz by category/topic Customer engagement Method of content discovery Market share Rate of customer acquisition Clicks Buzz by impressions New product adoption No of user-generated submissions received User-initiated views Rate of service adoption CPM Click through rate (CTR) Customer acquisition/retention costs Influence of publishers reached Asset popularity Cost per 1000 impressions (CPM) Mainstream media mentions % of buzz containing links Friends Shift in buzz over time Change of market share Comments Discount redemption rate Buzz by stage in purchase funnel Influence of consumers reached % of traffic through earned media Attendance generated at IRL events Fans Impact on first contact resolution Conversion change due to user ratings/reviews Buzz by time of day Uploads SE share of voice through SM Followers Earned media impact on results from paid media Tags added Downloads Impact on offline sales Impact on online sales Impact on other offline behaviour Time spent with distributed content Exposures of virtual gifts Time spent on site through SM referrals % of buzz containing multimedia Embeds/installs Savings generated by enabling customers to connect with each other Social media metrics Online marketing objectives Marketing objectives Core business objectives Purchase consideration Increase in searches Clicks Likes/favourites Polls taken/votes received Number of virtual gifts given Brand association Impact of offline marketing Relative popularity of content Influence of brands on SM networks No of chatroom participants Volume of customer feedback generated Responses to socially posted events Registrations from 3rd party social logins Customers assisted Seasonality of buzz Growth rate of fans etc Visits to store locator pages Savings per customer assisted Ratings Products sampled Leads Suggestions implemented form SM feedback Buzz by posts R&D time saved 2nd degree reach Social media habits/interests of target audience Ratio of embeds or Attributes of tags favouriting to views Share of voice SE ranking based on SM Job applications received Average conversion value Frequency of social interactions per consumer Impressions Sentiment by volume of posts Customer buying frequency Shift in sentiment before, during and after activity Impact on customer lifetime value Employees reached Rate of growth compared to competition Pageviews Wiki contributors Sentiment by volume of impressions Conversion rate Customer value Social Competitive buzz Market share Costs saved on research bookmarks Demographics of audience reached Conversions Leads generated Advocacy and loyalty Rate of virality/pass along Increase revenue Reduce expenditure No of interactions Rate of customer/visitor retention Share of preference Improve customer experience Interaction/engagement available Contest entries View-throughs Share of voice Cost per click CPC Subscriptions (RSS, podcasts, video series) Change in virality rates over time Brand recognition Average order value Buzz by social channel Buzz by category/topic Customer engagement Method of content discovery Market share Rate of customer acquisition Clicks Buzz by impressions New product adoption No of user-generated submissions received User-initiated views Rate of service adoption CPM Click through rate (CTR) Customer acquisition/retention costs Influence of publishers reached Asset popularity Cost per 1000 impressions (CPM) Mainstream media mentions % of buzz containing links Friends Shift in buzz over time Change of market share Comments Discount redemption rate Buzz by stage in purchase funnel Influence of consumers reached % of traffic through earned media Attendance generated at IRL events Fans Impact on first contact resolution Conversion change due to user ratings/reviews Buzz by time of day Uploads SE share of voice through SM Followers Earned media impact on results from paid media Tags added Downloads Impact on offline sales Impact on online sales Impact on other offline behaviour Time spent with distributed content Exposures of virtual gifts Time spent on site through SM referrals % of buzz containing multimedia Embeds/installs Savings generated by enabling customers to connect with each other Social media metrics Online marketing objectives Marketing objectives Core business objectives
Demonstrate your online marketing ROI (Infographic)
Source
http://pasco...fographic/Category
Social MediaGet a Quote
You may also like...