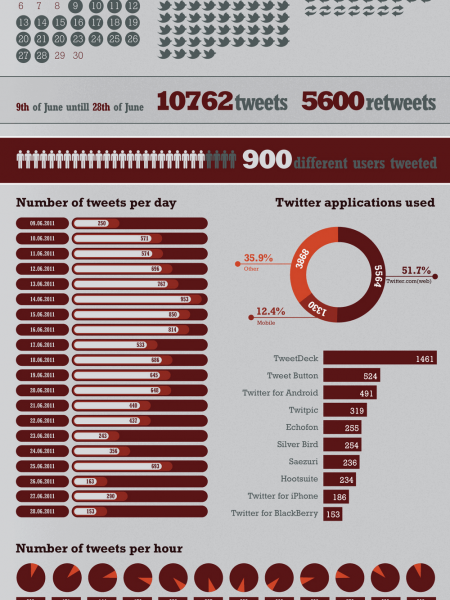
Women in Politics
WÖMEN IN POLITICS IN ...1946...............1990...........2000..... first woman elected in parliament received the right to vote could stand for election first woman mayor Women in Municipal Elections 1996 2000 2005 2009 2013 92.8%, 93.9%, 95.3% 96.4%, 91.2% Number of Women Candidates for Mayor 7.2% 6.1% 4.7% 3.6% 8.8% 100% 97.6% 96.5% 100% 95.3% Women Mayors Elected 2.4% 3.5% 4.7% 93.8% 91.6% 77.7% 73.3% 69.8% Women Councillors Elected 6.2% 8.4% 22.4% 26.7% 30.2% Women Mayors April 2013 % of women 8.8% candidates for mayor (elections 2013) 4.7% % of women elected for mayor (elections 2013) Women Elected in Parliamentary Elections before quotas after quotas- 1990 1994 1998 2002 2006 2008 2011 4.1%3.1% 7.5% 18.3% 27.5% 30.8% 33% The barriers to having more women in politics? Childcare Candidate selection Cash procedures women are more likely to have this responsibility or other family responsibilities women tend to have less access Political parties play an important role in determining voter's choices, and globally the main hurdle women face is getting selected as candidates, and as getting selected for win -able seats. Confidence to resources than men Culture women are less politics is still seen as likely to go forward for selection the domain of men Produced by the Office of the UN Resident Coordinator, Skopje, April 2013 infographic by APOLOIMAGES
Women in Politics
Source
Unknown. Add a sourceCategory
PoliticsGet a Quote
You may also like...