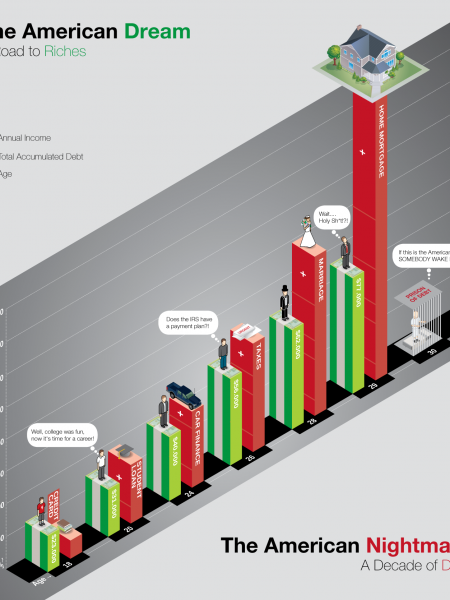
Sizing Up The American Dream
OPTIMISM The phrase "Do you think you will reach, as you define it, the American dream in your lifetime?" "American dream" 59% Source: is often understood Pew Economic Mobility Project Poll: "Economic Mobility to mean that each of American and the American Dream" (March 2011) generation will do 37% Have already achieved it parents say they Will achieve 31% the American 70% better than the think it will be dream "somewhat" or previous one and "much" harder that with hard work, of Americans believe 27% 6% Other for their children to achieve the the American dream anyone can improve is still "very much" or Will not his economic American dream. "somewhat" alive. achieve it situation. THE HOUSE Americans' homes Homeownership 2010 65.1% come in all shapes and sizes, but owning one's home Source: 70% In 2010, U.S. Census Bureau WEST VIRGINIA had the highest homeownership (73.4 percent) has long been considered a 60 • WASHINGTON, D.C., benchmark of had the lowest (42 percent) economic success 50 in the United States. 1940 46,5% 74% 59% 52% 48% 45% 40 American Indian White Asian Hispanic Black 1940 1950 1960 1970 1980 1990 2000 2010 (not Hispanic) THE CAR Americans are Household car ownership, by number of vehicles renowned for their Source: One 100% By 2010, love affair with the U. S. Department of Transportation, U.S. Census Bureau Two 91% automobile. The Three+ 80 appeal of the car and the lure of the open None of households had at least one car 60 road have been 40 - And the average commute captured in was 25.3 minutes American pop 20 culture for decades. 1960 1970 1980 1990 2000 2010 Education is often Meanwhile, the cost of attending college – and the debt incurred to do so - have skyrocketed. THE DEGREE Educational attainment, ages 25-29 called "the great Completed 4+ years of high school Completed 4+ years of college Note: Consistent educational equalizer" – the Average student loạn balance (2011) $23,300 attainment data not available tool that is meant to for all years between 38% 89% 6% 32% enable anyone in 1940 and 1964. Sources: America to succeed. 1940 2011 1940 2011 Total tuition and room and board (in 2008-09 dollars) Current Population Survey (U.S. Census Bureau, U.S. Bureau of Labor Statistics), National Center for Education Statistics (Department of Education), Federal Reserve Bank New York The vast majority of 100 % Private $35,000 Americans complete high school, and Public $31,876 30,000 80 the percentage of people with a college HIGH SCHOOL: 89.0% 25,000 60 COLLEGE: 32.2% 20,000 degree continues 40 to climb. $12,681 15,000 20 10,000 5,000 1940 1950 1960 1970 1980 1990 2000 2010 1970- 1980- 1990- 2000- 2009- 1971 1981 1991 2001 2010 THE MONEY The benchmarks Household median income (in 2010 dollars) Americans living below the poverty level many equate with economic success - All Races $80,000 1960 2010 Note Consistent data not available for all years. -- Asian 22.4% 15.1% 70.000 rely on one thing: White (not Hispanic) 60.000 Source: U.S. Census Bureau, Federal Reserve Bank of St. Louis money. Income varies widely, and --- Hispanic: (any race) 50,000 Today, fewer Americans live in poverty, but, on w Black 40,000 the recent economic average, they are also saving less. 30,000 downturn has taken Personal saving rate (annualized) 20,000 a toll on many 1960 2011 10,000 households. 7.2% 4.7% 1970 1980 1990 2000 2010
Sizing Up The American Dream
Source
http://www.n...ican-dreamCategory
LifestyleGet a Quote


