Is Your Boss Younger Than You?
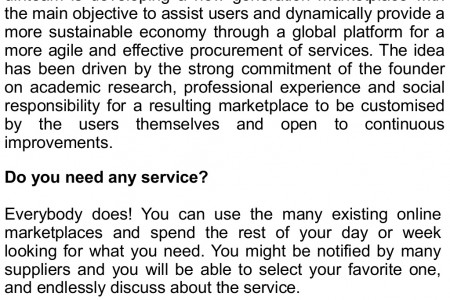
FOCUS FYI BUSINESS DATA & INFOGRAPHICS BY FOCUS.COM Is Your Boss Younger Than You? 43% Percentage of workers that find difficult to report to someone younger 25-34 years old 45-54 years old 55 and 1 workers aged 35 and older say they currently report to someone younger Breaking it down by age: More than half (53%) of workers ages 45 and up said they are older than their bosses. Perhaps, not surprisingly, the 16% 7% 5% number climbs to 69% for workers ages 55 and up. % of all economically active % of working age Unemployment rate Seasonally adjusted / Sampling variability :0.3% Working age employment rate Seasonally adjusted / Sampling variability :0.4% 8.0 75.5 75.0 7.5 74.5 7.0 74.0 6.5 73.5 6.0 73.0 72.5 5.5 72.0 Dec-Feb Dec-Feb Dec-Feb Dec-Feb Dec-Feb Dec-Feb 2008 2009 2010 2008 2009 2010 Of the 121 million wonmen Of persons aged age 16 years and over in the U.S. 25 years and older 59.5% 30% 29% 31% were labor force participants working or looking for work had completed only high school, no college had attained a bachelor's degree or higher Labor force participation Unemployment rate for women age 25 and over for women age 25 and over • With less than a highschool diploma 33% • With less than a highschool diploma 9.4% • With high school diploma - no college 53% • With high school diploma - no college 5.3% • With some college - no degree 63% • With some college - no degree 5.1% • With associate degree 72% • With associate degree 3.7% • With bacheor degree 73% • With bacheor degree 2.7% Employment status of the civilian noninstitutional population by age / 2009 (Numbers in thousands) Civilian labor force Employed - Unemployed - Age Civillan noninstitutional population Percent of population Percent of population Percent of labor force Not in labor force Total Total Number 16 years and over 235,801 154,142 65.4 139,877 59.3 14,265 9.3 81,659 16 to 19 years 17,043 6,390 37.5 4,837 28.4 1,552 24.3 10,654 16 to 17 years 8,944 2,227 24.9 1,651 18.5 576 25.9 6,717 18 to 19 years 8,100 4,163 51.4 3,187 39.3 976 23.4 3,937 20 to 24 years 20,524 14,971 72.9 12,764 62.2 2,207 14.7 5,553 25 to 54 years 125,565 103,742 82.6 95,144 75.8 8,597 8.3 21,823 25 to 34 years 40,280 33,298 82.7 30,014 74.5 3,284 9.9 6,982 25 to 29 years 20,872 17,138 82.1 15,315 73.4 1,822 10.6 3,735 30 to 34 years 19,408 16,160 83.3 14,699 75.7 1,461 9.0 3,248 35 to 44 years 40,919 34,239 83.7 31,517 77.0 2,722 7.9 6,681 35 to 39 years 20,174 16,868 83.6 15,486 76.8 1,382 8.2 3,306 40 to 44 years 20,746 17,370 83.7 16,031 77.3 1,340 7.7 3,375 45 to 54 years 44,365 36,205 81.6 33,613 75.8 2,592 7.2 8,160 45 to 49 years 22,683 18,803 82.9 17,455 77.0 1,347 7.2 3,880 50 to 54 years 21,682 17,402 80.3 16,158 74.5 1,245 7.2 4,280 55 to 64 years 34,671 22,505 64.9 21,019 60.6 1,487 6.6 12,165 55 to 59 years 18,882 13,799 73.1 12,887 68.3 913 6.6 5,082 60 to 64 years 15,789 8,706 55.1 8,132 51.5 574 6.6 7,083 65 years and over 37,998 6,534 17.2 6,114 16.1 421 6.4 31,464 65 to 69 years 11,657 3,629 31.1 3,380 29.0 249 6.8 8,028 Sources: • Shine from Yahool - Is Your Boss Younger than You? http://shine yahoo.com • United States Department of Labor - Labor Force Statistics from the Current Population Survey http://www.bls.gov • Uniled States Department of Labor - Quick Stats on Women Workers, 2008 http://www.dol.gowwb/stats/main.htm • National Statistics Online - Employment http://www.statistics gov.uk
Is Your Boss Younger Than You?
Source
Unknown. Add a sourceCategory
EconomyGet a Quote
You may also like...