
Where The Jobs Are
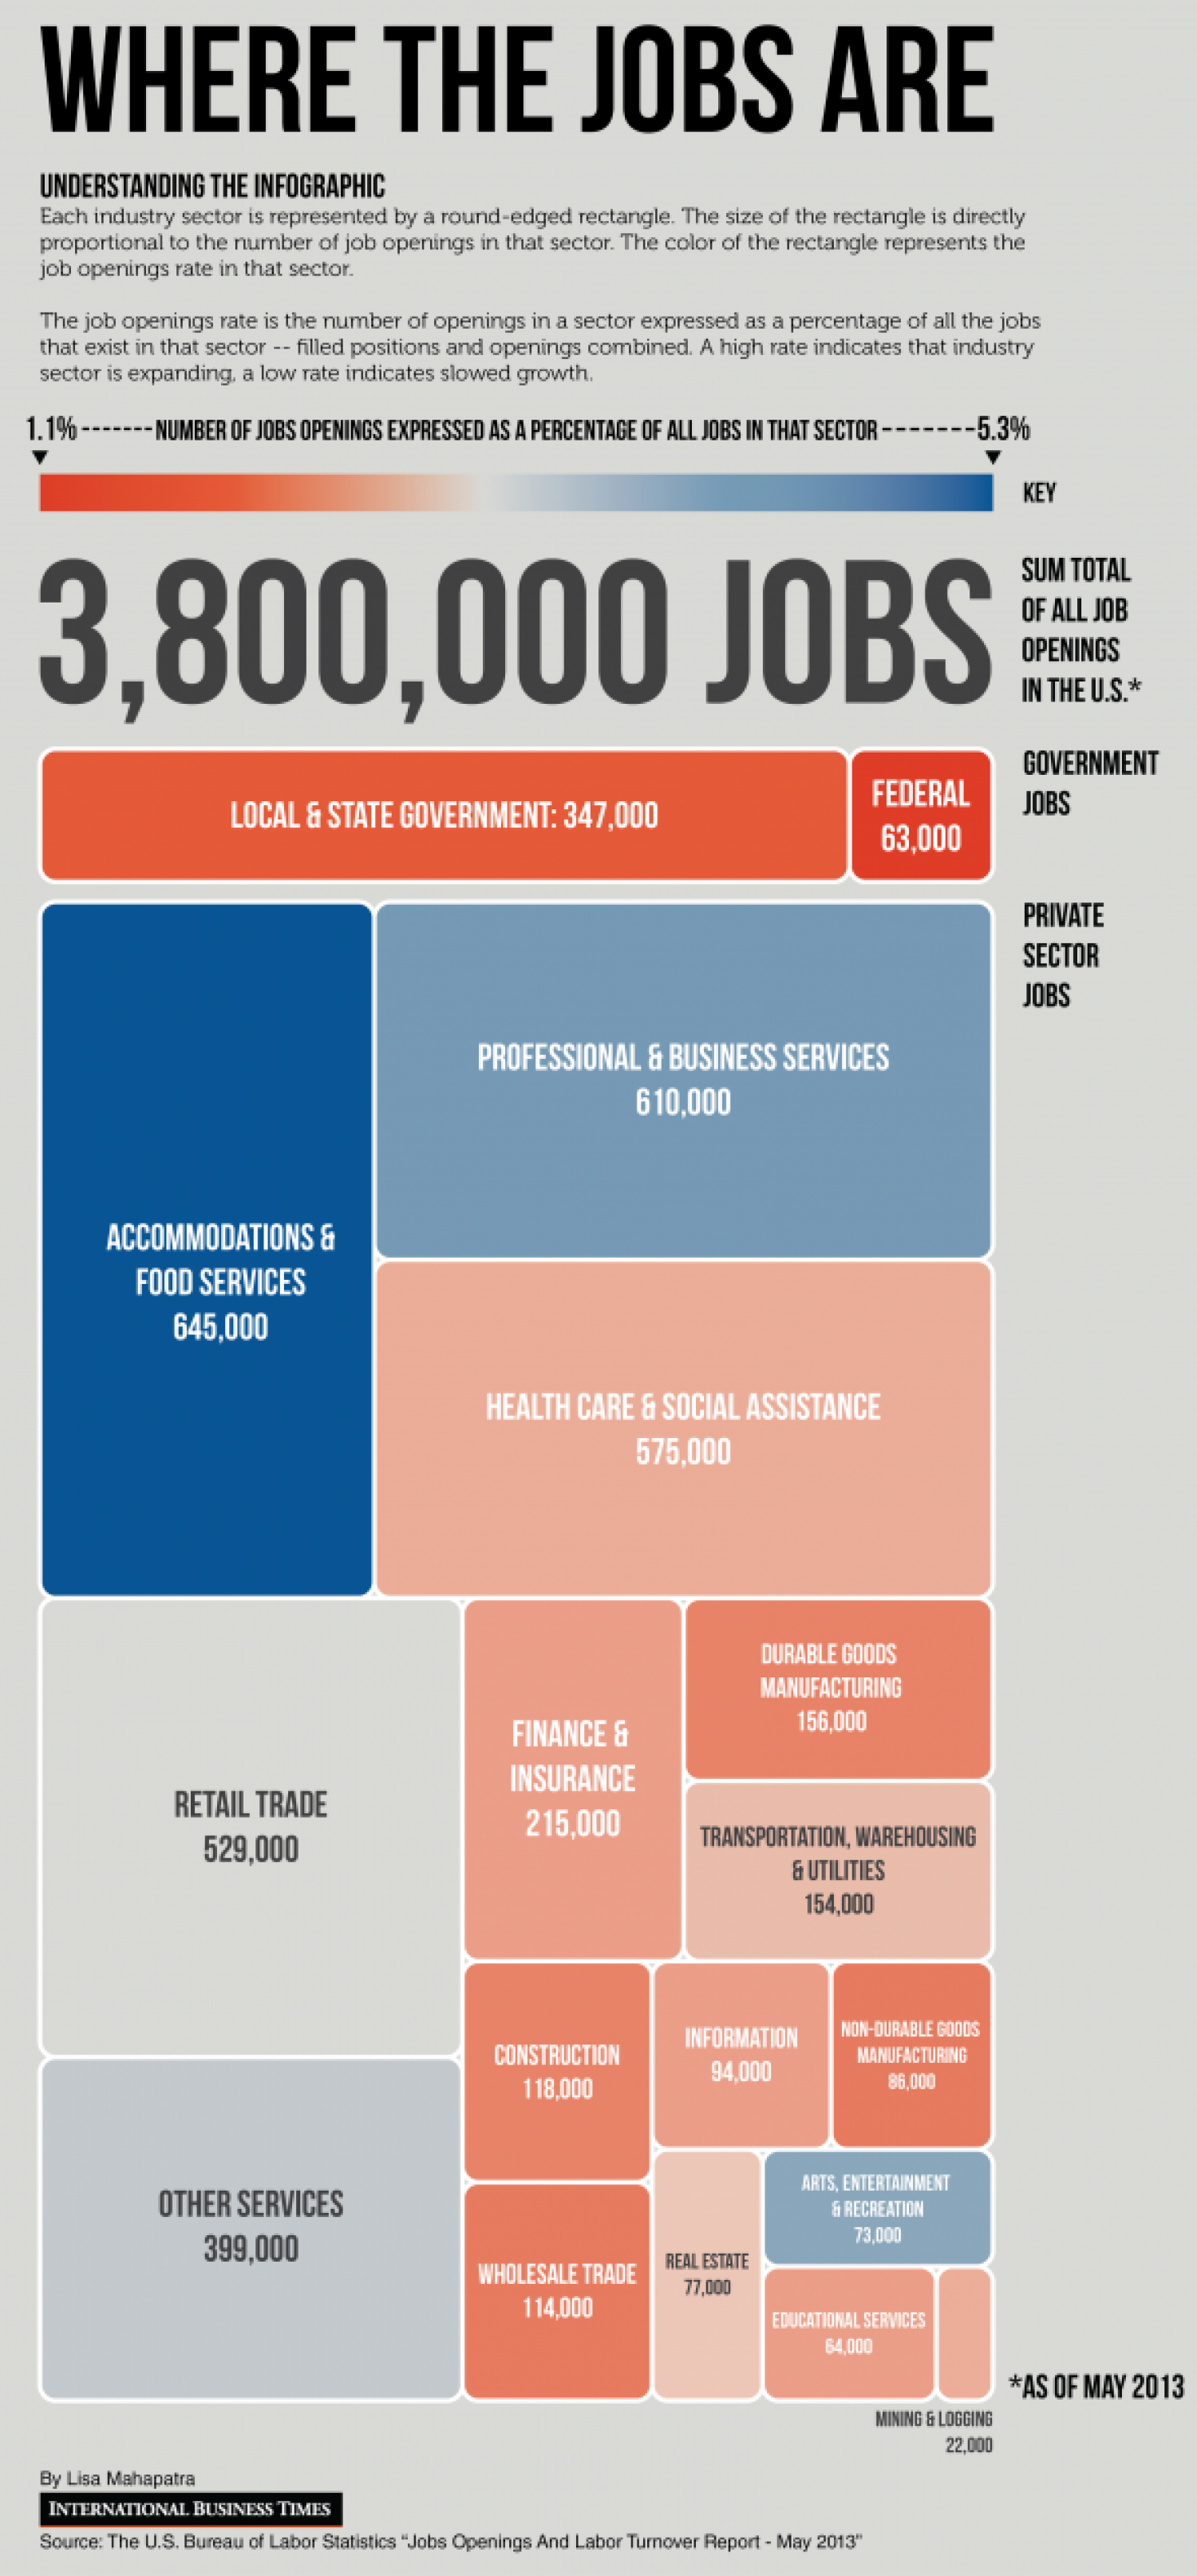
WHERE THE JOBS ARE UNDERSTANDING THE INFOGRAPHIC Each industry sector is represented by a round-edged rectangle. The size of the rectangle is directly proportional to the number of job openings in that sector. The color of the rectangle represents the job openings rate in that sector. The job openings rate is the number of openings in a sector expressed as a percentage of all the jobs that exist in that sector -- filled positions and openings combined. A high rate indicates that industry sector is expanding, a low rate indicates slowed growth. 1.1% ------- NUMBER OF JOBS OPENINGS EXPRESSED AS A PERCENTAGE OF ALL JOBS IN THAT SECTOR ---- -5.3% KEY 3,800,000 JOBS SUM TOTAL OF ALL JOB OPENINGS IN THE U.S.* GOVERNMENT FEDERAL JOBS LOCAL & STATE GOVERNMENT: 347,000 63,000 PRIVATE SECTOR JOBS PROFESSIONAL & BUSINESS SERVICES 610,000 ACCOMMODATIONS & FOOD SERVICES 645,000 HEALTH CARE & SOCIAL ASSISTANCE 575,000 DURABLE GOODS MANUFACTURING 156,000 FINANCE & INSURANCE RETAIL TRADE 215,000 TRANSPORTATION, WAREHOUSING 529,000 & UTILITIES 154,000 INFORMATION NON-DURABLE GOODS CONSTRUCTION MANUFACTURING 94,000 118,000 86,000 ARTS, ENTERTAINMENT OTHER SERVICES 399,000 & RECREATION 73,000 REAL ESTATE WHOLESALE TRADE 77,000 114,000 EDUCATIONAL SERVICES 64,000 *AS OF MAY 2013 MINING & LOGGING 22,000 By Lisa Mahapatra INTERNATIONAL BUSINESS TIMES Source: The U.S. Bureau of Labor Statistics "Jobs Openings And Labor Turnover Report - May 2013"
Where The Jobs Are
Source
http://www.i...nfographicCategory
EconomyGet a Quote
You may also like...


