
Keeping Pace?
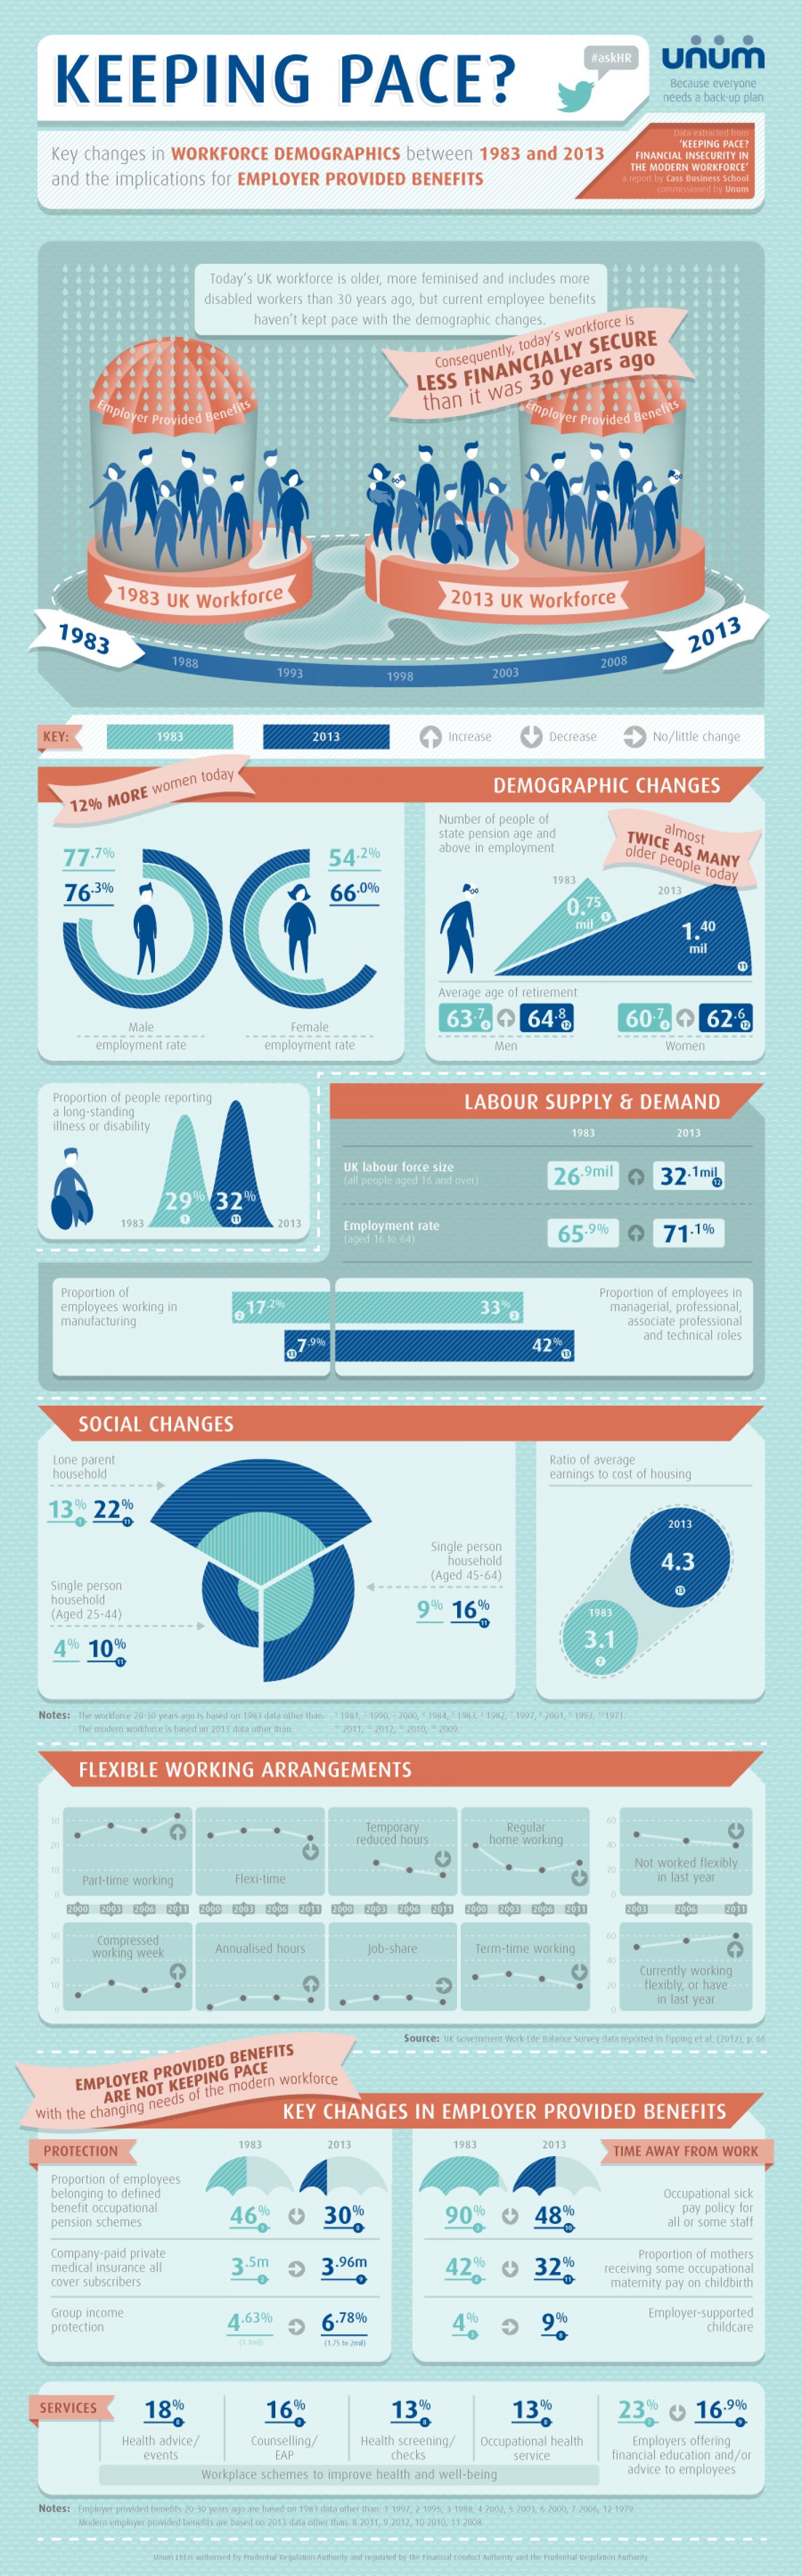
KEEPING PACE? unum #askHR Because everyone needs a back-up plan Data extracted from Key changes in WORKFORCE DEMOGRAPHICS between 1983 and 2013 and the implications for EMPLOYER PROVIDED BENEFITS 'KEEPING PACE? FINANCIAL INSECURITY IN THE MODERN WORKFORCE a report by Cass Business School commissioned by Unum Today's UK workforce is older, more feminised and includes more disabled workers than 30 years ago, but current employee benefits haven't kept pace with the demographic changes. Consequently, today's workforce is LESS FINANCIALLY SECURE than it was 30 years ago oemployer Provided Benefits Employer Provided Benefits 1983 UK Workforce 2013 UK Workforce 1983 1988 2013 1993 2008 1998 2003 KEY: 1983 2013 Increase Decrease No/little change DEMOGRAPHIC CHANGES 12% MORE women today Number of people of state pension age and above in employment almost TWICE AS MANY 77.7% older people today 54.2% 76.3% 1983 66.0% 2013 0.75 mit O 1.40 mil Average age of retirement 63%O 64% 60%O 62.6 Male Female ----- ----- ----- employment rate employment rate Men Women Proportion of people reporting a long-standing illness or disability LABOUR SUPPLY & DEMAND 1983 2013 UK labour force size 26.9mil o 32:1mil (all people aged 16 and over) 299 32 1983 2013 Employment rate (aged 16 to 64) 65.9% O 71:1% Proportion of employees working in manufacturing Proportion of employees in managerial, professional, associate professional and technical roles 172% 33% 079% 42% SOCIAL CHANGES Lone parent household Ratio of average earnings to cost of housing 13% 22 2013 Single person household (Aged 45-64) 4.3 Single person household (Aged 25-44) 9% 16% 1983 4% 10% 3.1 Notes: The workforce 20-30 years aga is based on 1983 data other than: 11981, 1990, 2000, 1984, 5 1983, 1982, 1997, 2001, ° 1993, 10 1971. The modern workforce is based on 2013 data other than: 11 2011, 2012, 2010, 2009, - -- - - - - FLEXIBLE WORKING ARRANGEMENTS 30 Temporary reduced hours 60 Regular home working 20 40 Not worked flexibly in last year Part-time working Flexi-time 2003 2006 2011 30 Compressed working week 60 Annualised hours Job-share Term-time working 20 40 Currently working -flexibly, or have in last year 10 20 Source: UK Government Work-Life Balance Survey data reported in fipping et al. (2012), p. 66 EMPLOYER PROVIDED BENEFITS ARE NOT KEEPING PACE With the changing needs of the modern workforce KEY CHANGES IN EMPLOYER PROVIDED BENEFITS PROTECTION 1983 2013 1983 2013 TIME AWAY FROM WORK Proportion of employees belonging to defined benefit occupational pension schemes Occupational sick pay policy for all or some staff 46 O 30% 90% 48% Company-paid private medical insurance all Proportion of mothers receiving some occupational maternity pay on childbirth 3.5m 3.96m 42 32% cover subscribers Group income protection 4.63% 6.78% Employer-supported childcare (1. Imil) (1.75 to 2mil) SERVICES 18% 16% 13% 13% 23% o 16.9% Health advice/ Counselling/ EAP Health screening/ Occupational health service Employers offering financial education and/or advice to employees events checks Workplace schemes to improve health and well-being Notes: Employer-provided benefits 20-30 years ago are based on 1983 data other than: 1 1997, 2 1995, 3 1988, 4 2002, 5 2003, 6 2000, 7 2006, 12 1979. Modern employer pravided benefits are based on 2013 data other than: 8 2011, 9 2012, 10 2010, 11 2008. Unum Lid is authorised by Prudential Regulation Authority and regulated by the Financial Conduct Authority and the Prudential Regulation Authority
Keeping Pace?

Source
http://www.m...workforce/Category
BusinessGet a Quote
You may also like...


