eCommerce Shopping Behavior Statistics
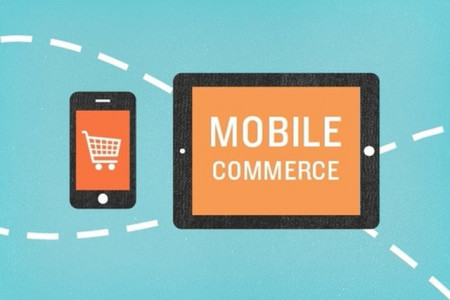
SHOPPING ВЕНAVIOR STATS eCommerce Shopping Behavior Trends and Predictions During 2015, there will be more than 200 million online shoppers in the United States, according to Statista's projections. By 2018, these figures are expected to exceed 215 million online shoppers in the U.S. alone. The eCommerce market is growing every year, demanding brands and organizations to regularly deliver new, innovative experiences. Here are 23 enlightening statistics, trends and predictions to accelerate your marketing plans and guide you towards a better shopping experience. 26% Spontaneous 26% of U.S. shoppers consider their purchases unplanned and spontaneous, without collecting information on products before buying. The top 3 reasons why U.S. shoppers buy online instead of in-store are: SALE! 52% 47% 40% being able to shop 24/7 not needing to travel to a lower prices and better deals then in-store physical store 60% of online shoppers would prefer to receive relevant incentives or promotions from a brand before shopping online. 2017 By the end of 2017, Forrester Research predicts that U.S. mobile users will spend an astonishing $90B via mobile payments. $90B $ $ 202% During 2014, eCommerce orders coming from social media grew by 202%. Social in media has become an effective f way to attract sales. SHOPPING CART ABANDONMENT STATISTICS 68%* In the overall eCommerce market, about 68% of all shopping carts are abandoned. REASONS FOR ABANDONING CARTS (U.S. 2014) Unexpected shipping costs 58% I wanted to get an idea of the total cost 57% I wanted to save the cart for later 55% My order value didn't qualify for free shipping 50% My preferred payment option was not offered 25% I got distracted and forgot to complete the purchase 24% 3-STAGE CART ABANDONMENT TIMELINE Phase of the Customer Journey Pre-Abandonment Display of Abandonment Intent Post-Abandonment e UX Optimization 3 Behavioral Exit-Intent Overlays Dynamic Remarketing Display Ads Personalized Product V Online Surveys Recommendations Personalized Emails E Live Chat Personalized Offers Personalized Landing Pages Free shipping increases cart conversion rates and encourages 93% of shoppers to buy more items. IN SUMMARY As smartphones become more popular across all demographics in the US and abroad, online mobile shopping is unsurprisingly becoming more popular. Desktop shopping continues to remain popular, although mobile traffic is quickly surpassing it as a percentage of all online traffic. However, smartphone users still prefer to complete a purchase either on a desktop computer or in-store. While customers enjoy the convenience of shopping online regardless of device, better deals including free shipping and favorable return policies are still the most important factor for completing purchases online instead of in-store. Sources: comScore, Baymard Institute, Consumer Barometer, PWC, Invesp, Forrester, Shopify, Compete DYNAMIC YIELD
eCommerce Shopping Behavior Statistics
Source
https://www....ior-stats/Category
BusinessGet a Quote
You may also like...