Blog > Where the Highest Rates of Chlamydia Are Diagnosed in the U.S. Share Where the Highest Rates of Chlamydia Are Diagnosed in the U.S.
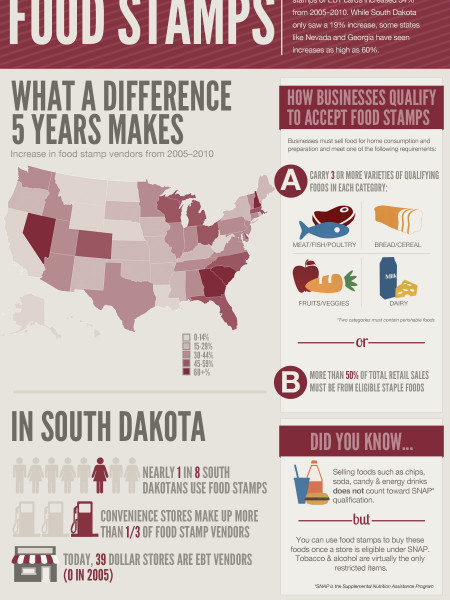
WHERE THE HIGHEST RATES OF CHLAMYDIA ARE DIAGNOSED IN THE U.S. 32 21 22 12 6 46 7 10 39 24 35 42 23 14 30 36 20 38 40 19 37 28 50 2541 15 11 29 45 16 26 31 13 2 47 17 18 33 27 Rank County Rate per 100,000 People Rank County Rate per 100,000 People 26 Crittenden County, AR 27 Holmes County, MS 28 East Carroll Parish, LA 29 Dougherty County, GA 30 Portsmouth City, VA 31 Phillips County, AR 32 Glacier County, MT 33 Washington County, MS 34 Baltimore City, MD 35 Richmond City, VA 36 Norfolk City, VA 37 Lincoln Parish, LA 1 Armstrong County, TX 2 Kalawao County, HI 5215.5 1364.1 3409.1 1353.0 Bethel Census Area, AK 3264.0 1347.2 4 Northwest Arctic Borough, AK 3045.3 1335.2 5 Nome Census Area, AK 3003.7 1331.3 6 Dewey County, SD 7 Todd County, SD 8 Sioux County, ND 9 Dillingham Census Area, AK 10 Buffalo County, SD 11 Terrell County, GA 12 Corson County, SD 13 Tunica County, MS 14 Petersburg City, VA 15 Liberty County, GA 16 Duval County, TX 17 Coahoma County, MS 18 Leflore County, MS 19 Hale County, AL 20 Franklin City, VA 21 Benson County, ND 22 Rosebud County, MT 23 Allendale County, SC 24 St. Louis City, MO 25 Madison Parish, LA 2570.7 1330.0 2553.4 1327.0 2330.9 1313.3 2108.7 1310.1 1901.0 1307.7 1855.9 1303.6 1808.2 1302.8 1805.7 38 Nottoway County, VA 39 District of Columbia, DC 1302.3 1729.1 1298.9 40 Noxubee County, MS 41 Jefferson County, MS 42 Richmond County, GA 43 Philadelphia County, PA 44 Radford City, VA 45 Orleans Parish, LA 1720.3 1284.7 1712.1 1280.6 89.4 1278.5 1505.7 1278.2 1505.5 1274.2 1431.0 1264.7 46 Big Horn County, MT 47 Jefferson County, AR 1427.3 1257.5 1427.3 1248.6 48 Mississippi County, AR 49 Bennett County, SD 50 Hinds County, MS 1421.9 1245.3 1421.8 1244.9 1378.6 1237.2 THE CHANGE IN CHLAMYDIA DIAGNOSIS RATES BY STATE SINCE 2000 Diagnosis Rate per 100K People: 0-100 101-200 201-300 301-400 401-500 501-600 601-700 701-800 801-900 901-1,000 1,001-1,100 1,100+ States With the Biggest| States With the Smallest Rate Increase Rate Increase 123% || Texas 115% || Louisiana South Carolina 109% || Kentucky 102% || Delaware North Dakota 102% || Georgia 2000-2006 Vermont -2% New York 3% 4% Utah 6% 17% 2000 2006 92% || Hawaii 86% || Alaska 60% || South Carolina 12% New Hampshire 53% || New Mexico 51% || Delaware 2006-2012 Arkansas 4% Kentucky West Virginia 12% 13% Теxas 14% 44% || West Virginia -23% 34% || Alabama 34% | Mississippi 33% || Vermont 32% Wyoming 2012-2018 Nevada Oregon Idaho -8% -4% California 0% New Jersey 3% 2012 2018 Note: All data is from 2018 CEUfast SOURCES: https://www.cdc.gov/nchhstp/atlas/index.htm https://gis.cdc.gov/grasp/nchhstpatlas/tables.html NURSING CE
Blog > Where the Highest Rates of Chlamydia Are Diagnosed in the U.S. Share Where the Highest Rates of Chlamydia Are Diagnosed in the U.S.
Publisher
CEUfastSource
https://ceuf...-in-the-usCategory
HealthGet a Quote
You may also like...