
Two Trends of Energy and Carbon Emissions in the Arab World
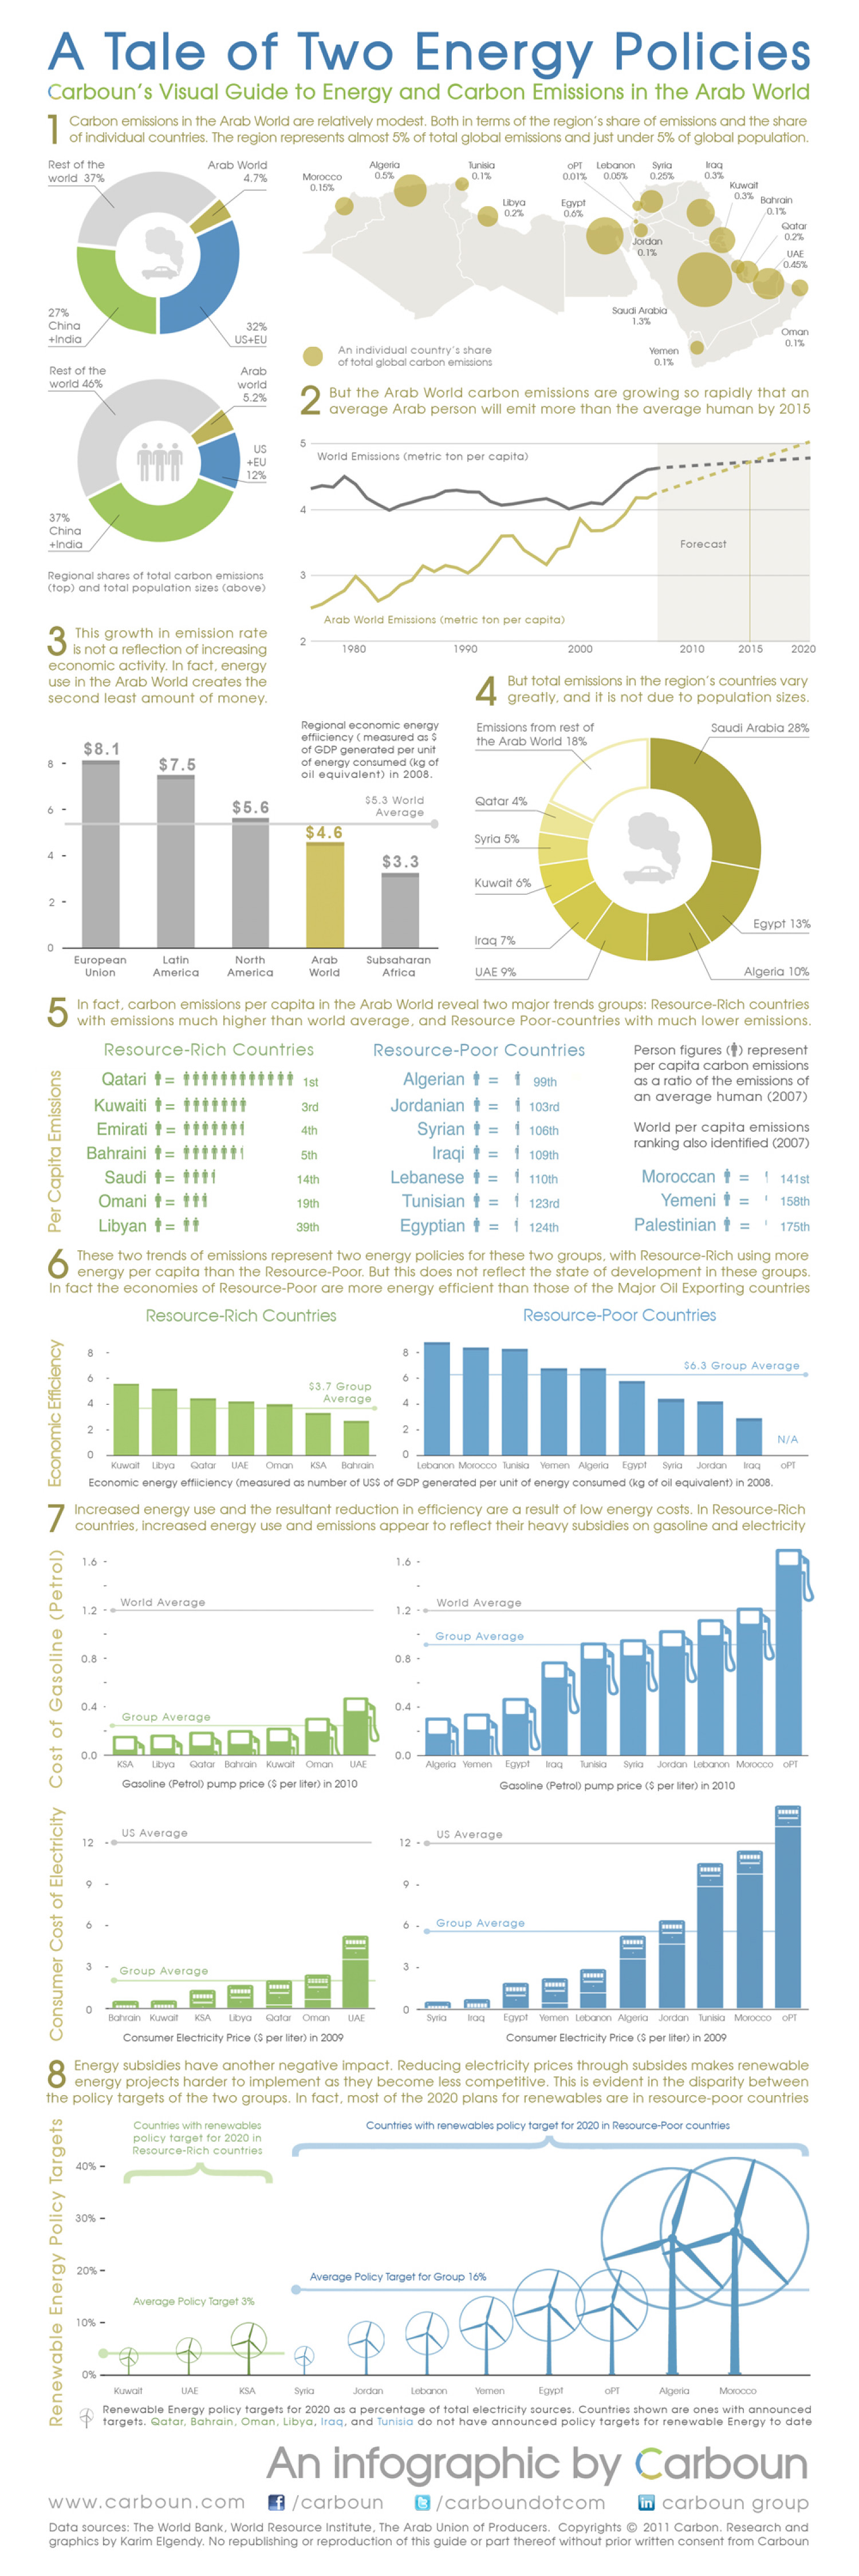
A Tale of Two Energy Policies Carboun's Visual Guide to Energy and Carbon Emissions in the Arab World 1 Carbon emissions in the Arab World are relatively modest. Both in terms of the region's share of emissions and the share of individual countries. The region represents almost 5% of total global emissions and just under 5% of global population. Rest of the Arab World Algeria 0.5% Syria 0.25% Tunisia OPT Lebanon Iraq 0.3% Morocco 0.15% world 37% 4.7% 0.1% 0.01% 0.05% Kuwait 0.3% Bahrain Libya 0.2% Egypt 0.6% 0.1% Qatar Jordan 0.2% 0.1% UAE 0.45% Saudi Arabia 27% China 1.3% 32% Oman 0.1% +India US+EU An individual country's share of total global carbon emissions Yemen 0.1% Arab world 5.2% Rest of the world 46% But the Arab World carbon emissions are growing so rapidly that an average Arab person will emit more than the average human by 2015 US +EU 12% World Emissions (metric ton per capita) 37% China +India Forecast Regional shares of total carbon emissions (top) and total population sizes (above) Arab World Emissions (metric ton per capita) 3 This growth in emission rate is not a reflection of increasing economic activity. In fact, energy 1980 1990 2000 2010 2015 2020 4 But total emissions in the region's countries vary greatly, and it is not due to population sizes. use in the Arab World creates the second least amount of money. Regional economic energy effiiciency ( measured as $ of GDP generated per unit of energy consumed (kg of oil equivalent) in 2008. Emissions from rest of Saudi Arabia 28% the Arab World 18% $8.1 $7.5 $5.3 World Qatar 4% $5.6 Average $4.6 Syria 5% 4 - $3.3 Kuwait 6% Egypt 13% Irag 7% Latin America Arab World European North Subsaharan Union America Africa UAE 9% Algeria 10% In fact, carbon emissions per capita in the Arab World reveal two major trends groups: Resource-Rich countries with emissions much higher than world average, and Resource Poor-countries with much lower emissions. Resource-Rich Countries Resource-Poor Countries Person figures (†) represent per capita carbon emissions as a ratio of the emissions of an average human (2007) Qatari t= tttttttttttt ist Algerian t = Jordanian † = i 99th 3rd i 103rd Emirati t = tiÍİÛİİ World per capita emissions ranking also identified (2007) Syrian t Iraqi i = i 109th Lebanese ↑ = 4th i 106th Bahraini t= ttIt1İ İ 5th Saudi t= tt† i Moroccan i = ! 141st Yemeni İ = 14th 1 110th Omani t= ††İ 19th Tunisian i = | 123rd 158th Libyan t = †1 Egyptian i = i 124th Palestinian t = I 175th 39th These two trends of emissions represent two energy policies for these two groups, with Resource-Rich using more energy per capita than the Resource-Poor. But this does not reflect the state of development in these groups. In fact the economies of Resource-Poor are more energy efficient than those of the Major Oil Exporting countries Resource-Rich Countries Resource-Poor Countries II $6.3 Group Average $3.7 Group Average N/A Kuwait Libya Qatar UAE Oman KSA Bahrain Lebanon Morocco Tunisia Yemen Algeria Egypt Syria Jordan Iraq OPT Economic energy effiiciency (measured as number of US$ of GDP generated per unit of energy consumed (kg of oil equivalent) in 2008. Increased energy use and the resultant reduction in efficiency are a result of low energy costs. In Resource-Rich countries, increased energy use and emissions appear to reflect their heavy subsidies on gasoline and electricity 1.6 - 1.6 - World Average World Average 1.2 1.2 Group Average 0.8 0.8 - 0.4 0.4 - Group Average 0.0 0.0 KSA Libya Qatar Bahrain Kuwait Oman UAE Algeria Yemen Egypt Iraq Tunisia Syria Jordan Lebanon Morocco OPT Gasoline (Petrol) pump price ($ per liter) in 2010 Gasoline (Petrol) pump price ($ per liter) in 2010 US Average US Average 12 12 - Group Average 3 - Group Average Bahrain Kuwait KSA Libya Qatar Oman UAE Syria Iraq Egypt Yemen Lebanon Algeria Jordan Tunisia Morocco OPT Consumer Electricity Price ($ per liter) in 2009 Consumer Electricity Price ($ per liter) in 2009 Energy subsidies have another negative impact. Reducing electricity prices through subsides makes renewable energy projects harder to implement as they become less competitive. This is evident in the disparity between the policy targets of the two groups. In fact, most of the 2020 plans for renewables are in resource-poor countries Countries with renewables Countries with renewables policy target for 2020 in Resource-Poor countries policy target for 2020 in Resource-Rich countries 40% 30% - 20% - Average Policy Target for Group 16% Average Policy Target 3% 10% - 0% Kuwait UAE KSA Syria Jordan Lebanon Yemen Egypt OPT Algeria Morocco Renewable Energy policy targets for 2020 as a percentage of total electricity sources. Countries shown are ones with announced targets. Qatar, Bahrain, Cman, Libya, Iraq, and Tunisia do not have announced policy targets for renewable Energy to date An infographic by Carboun www.carboun.com f /carboun B/carboundotcom in carboun group Data sources: The World Bank, World Resource Institute, The Arab Union of Producers. Copyrights © 2011 Carbon. Research and graphics by Karim Elgendy. No republishing or reproduction of this guide or part thereof without prior written consent from Carboun Renewable Energy Policy Targets 00 Consumer Cost of Electricity Cost of Gasoline (Petrol) N Economic Efficiency Per Capita Emissions
Two Trends of Energy and Carbon Emissions in the Arab World
Source
Unknown. Add a sourceCategory
EnvironmentGet a Quote


