
Race to Economic Growth
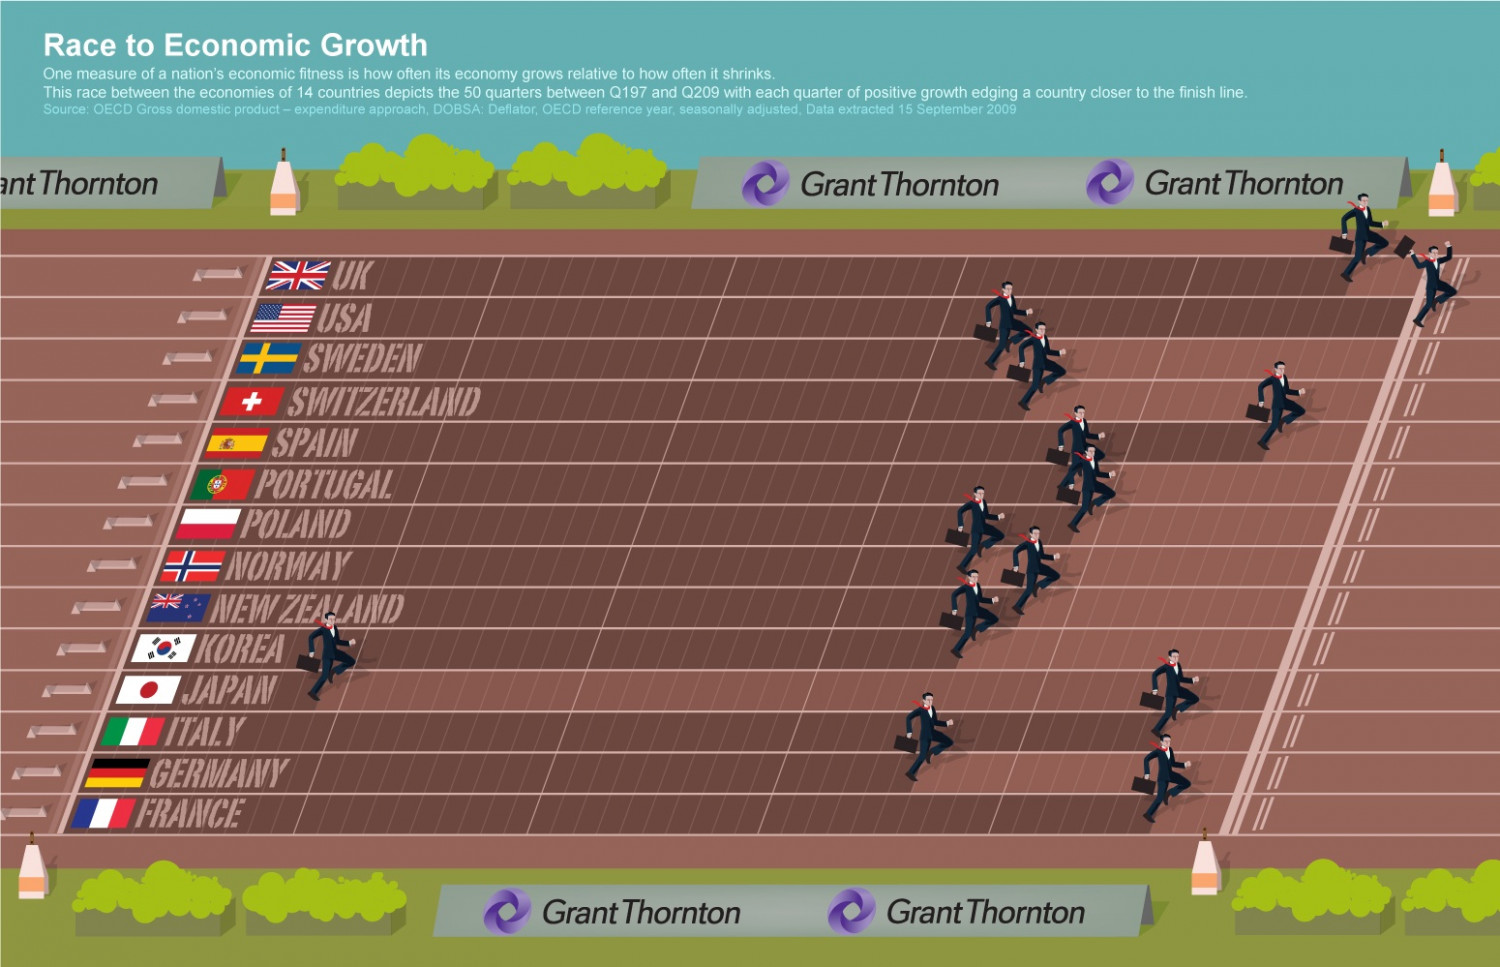
Race to Economic Growth One measure of a nation's economic fitness is how often its economy grows relative to how often it shrinks. This race between the economies of 14 countries depicts the 50 quarters between Q197 and Q209 with each quarter of positive growth edging a country closer to the finish line. Source: OECD Gross domestic product – expenditure approach, DOBSA: Deflator, OECD reference year, seasonally adjusted, Data extracted 15 September 2009 ant Thornton Grant Thornton Grant Thornton 米 UK USA SWEDEN + SWITZERLAND SPAIN PORTUGAL POLAND NORWAY MEW ZEALAND KOREA OJAPAN ITALY GERMANY FRANCE O Grant Thornton Grant Thornton Race to Economic Growth One measure of a nation's economic fitness is how often its economy grows relative to how often it shrinks. This race between the economies of 14 countries depicts the 50 quarters between Q197 and Q209 with each quarter of positive growth edging a country closer to the finish line. Source: OECD Gross domestic product – expenditure approach, DOBSA: Deflator, OECD reference year, seasonally adjusted, Data extracted 15 September 2009 ant Thornton Grant Thornton Grant Thornton 米 UK USA SWEDEN + SWITZERLAND SPAIN PORTUGAL POLAND NORWAY MEW ZEALAND KOREA OJAPAN ITALY GERMANY FRANCE O Grant Thornton Grant Thornton Race to Economic Growth One measure of a nation's economic fitness is how often its economy grows relative to how often it shrinks. This race between the economies of 14 countries depicts the 50 quarters between Q197 and Q209 with each quarter of positive growth edging a country closer to the finish line. Source: OECD Gross domestic product – expenditure approach, DOBSA: Deflator, OECD reference year, seasonally adjusted, Data extracted 15 September 2009 ant Thornton Grant Thornton Grant Thornton 米 UK USA SWEDEN + SWITZERLAND SPAIN PORTUGAL POLAND NORWAY MEW ZEALAND KOREA OJAPAN ITALY GERMANY FRANCE O Grant Thornton Grant Thornton Race to Economic Growth One measure of a nation's economic fitness is how often its economy grows relative to how often it shrinks. This race between the economies of 14 countries depicts the 50 quarters between Q197 and Q209 with each quarter of positive growth edging a country closer to the finish line. Source: OECD Gross domestic product – expenditure approach, DOBSA: Deflator, OECD reference year, seasonally adjusted, Data extracted 15 September 2009 ant Thornton Grant Thornton Grant Thornton 米 UK USA SWEDEN + SWITZERLAND SPAIN PORTUGAL POLAND NORWAY MEW ZEALAND KOREA OJAPAN ITALY GERMANY FRANCE O Grant Thornton Grant Thornton Race to Economic Growth One measure of a nation's economic fitness is how often its economy grows relative to how often it shrinks. This race between the economies of 14 countries depicts the 50 quarters between Q197 and Q209 with each quarter of positive growth edging a country closer to the finish line. Source: OECD Gross domestic product – expenditure approach, DOBSA: Deflator, OECD reference year, seasonally adjusted, Data extracted 15 September 2009 ant Thornton Grant Thornton Grant Thornton 米 UK USA SWEDEN + SWITZERLAND SPAIN PORTUGAL POLAND NORWAY MEW ZEALAND KOREA OJAPAN ITALY GERMANY FRANCE O Grant Thornton Grant Thornton Race to Economic Growth One measure of a nation's economic fitness is how often its economy grows relative to how often it shrinks. This race between the economies of 14 countries depicts the 50 quarters between Q197 and Q209 with each quarter of positive growth edging a country closer to the finish line. Source: OECD Gross domestic product – expenditure approach, DOBSA: Deflator, OECD reference year, seasonally adjusted, Data extracted 15 September 2009 ant Thornton Grant Thornton Grant Thornton 米 UK USA SWEDEN + SWITZERLAND SPAIN PORTUGAL POLAND NORWAY MEW ZEALAND KOREA OJAPAN ITALY GERMANY FRANCE O Grant Thornton Grant Thornton
Race to Economic Growth
Source
Unknown. Add a sourceCategory
EconomyGet a Quote
You may also like...


