Halloween Consumer Spending from 2005 - 2013
Happy Halloween Consumer Spending from 2005-2013 According to the National Retail Federation's Halloween Spending Survey, nearly 158 million consumers will participate in Halloween activities this year; spending on average $75.03 on décor, costumes, candy and fun. This is a decrease from the 170 million people who spent on average $79.82 last year. Overall, average spending on Halloween has increased 54.7% since 2005, with total spending estimated tO reach $6.9 billion in 2013. 2013 Halloween Statistics Candy Ava Buyer $234 Consumer Put Up Decorations % Buying: 95.6% Age 55-64: $22.22 Age 65+: $18.79 Men: 42.1% Women: 52.6% Income <$50K: 44.8% $50K+: 50.8% Age 55-64: 45.9% Age 65+: 49.6% Behavior Decorations Avg Buyer: $30.13 % Buying: 69.7% Age 55-64: $21.05 Age 65+: $21.73 Hand Out Candy Men: 72.3% Women: 71.7% Income <$50K: 69% $50K+: 76.1% Age 55-64: 80.6% Åge 65+: 82.5% Greeting Cards Avg Buyer: $10.59 % Buying: 36.1% Age 55-64: $7.18 Age 65+: $8.27 Surprise! Across all consumer segments, most people began their Halloween shopping in the 1st two weeks of October Of adults say that the state of the U.S. economy won't impact their Halloween plans 43.6% 74.8% TRANSAMERICA Source: National Retail Federation: Halloween 2013 TRANSFORM TOMORROW
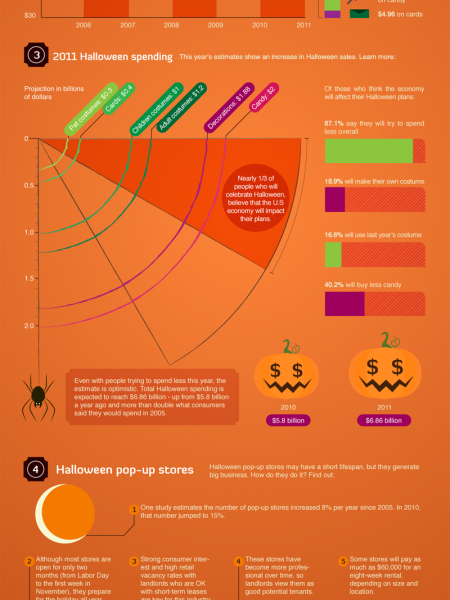
Halloween Consumer Spending from 2005 - 2013

Source
http://www.t...erica.com/Category
EconomyGet a Quote