
Transcribed
Fuel composition for Asia's energy requirements
2.1.3 Fuel composition for Asia's energy requirements NRE Нydro Nuclear Natural gas | Oil Coal МТОЕ 10,000 – 8,000 – 6,000 4,000 2,000 – 1990 1995 2000 2005 2010 2015 2020 2025 2030 2035 MTOE = million tons of oil equivalent, NRE = new and renewable energy. Source: Lee, Park, and Saunders, forthcoming.
Fuel composition for Asia's energy requirements
shared by W.E.R.I on Jun 30
137
views
0
faves
0
comments
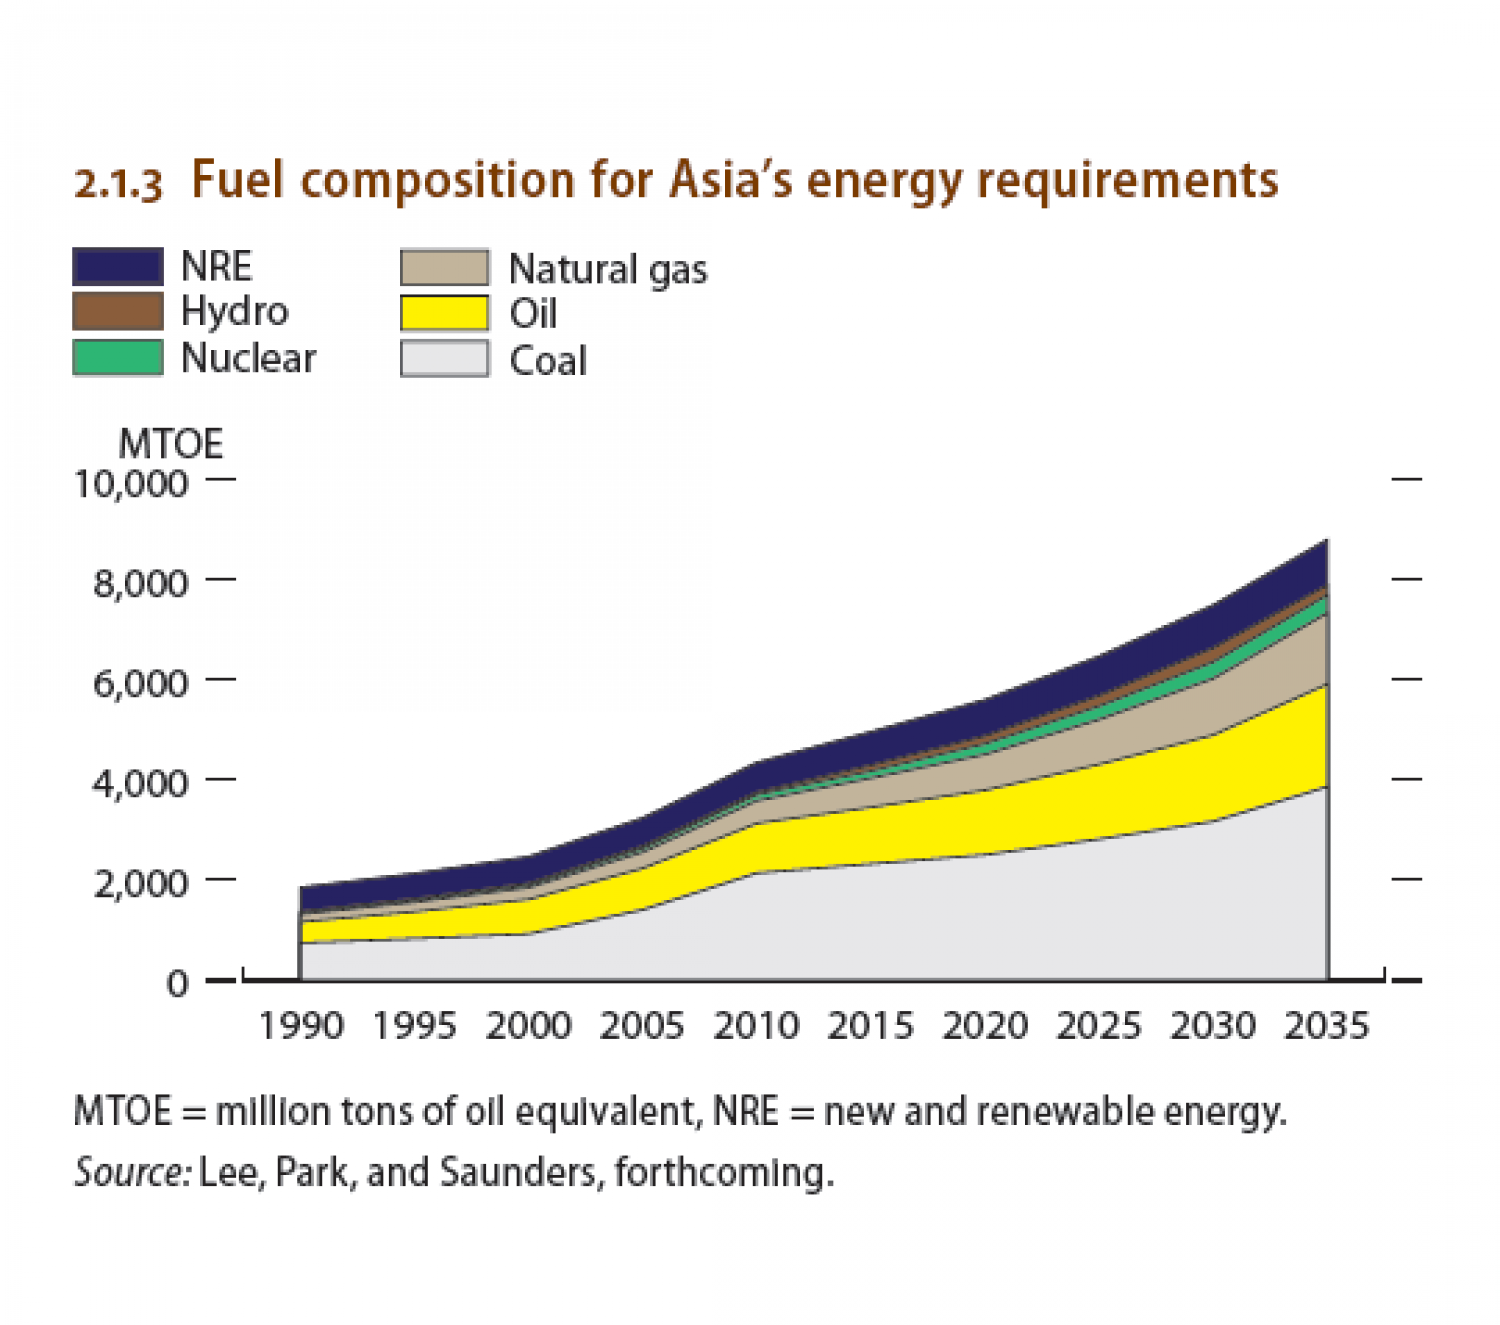
Aside from becoming higher, energy demand poses many
challenges for developing Asia in terms of its composition. In
particular, what is the mix of primary sources that will satisfy
Asia’s growing th...
irst for energy? The current composition
of Asia’s energy demand holds some important clues
(Figure 2.1.3).
Under the baseline scenario in Box 2.1.1, most of the twofold (202%) increase in energy consumption from 2010 to 2035 will come from fossil fuels. Coal use is expected to increase by 81% as oil consumption approximately doubles and natural gas use more than triples. The use of renewables is set to increase but will make a relatively small contribution to 2035 energy requirements. The same goes for nuclear power. Subregional differences in energy demand and the energy mix will be substantial by 2035. Following the Asia 2050 study’s forecasts (ADB 2011), the scenarios allow for large differences in subregional growth rates in the next 2 decades. Regional GDP growth will likely be dominated by South and East Asia—South Asia because of its high potential growth rate and East Asia because its growth at about 6% builds on its existing large share of developing Asia’s GDP (the two subregions will jointly account for 83% of developing Asia’s
GDP by 2035).
The IEA energy balances and statistics databases on CD-ROM provide annual historical energy data in four IEA/OECD data bases: energy statistics and energy balances, which contain data for most of the OECD countries for the years 1960 to 2010, with supply estimates for 2011, and energy statistics and balances for more than 100 non-OECD countries for the years 1971 to 2010.
World Energy Statistics 2012
http://www.iea.org/w/bookshop/add.aspx?id=619
Source
http://www.i...spx?id=619Category
EconomyGet a Quote


