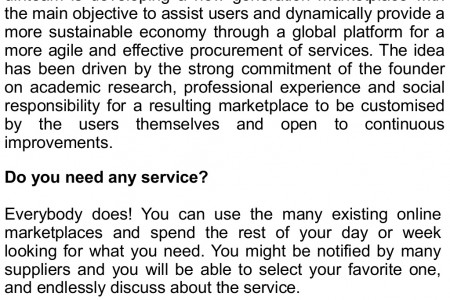
Profile of the UK Private Sector
Profile of the UK Private Sector These graphs show a profile of the UK's private sector split by number of employees; region and industry type. By Size (employees) Turnover 500 - or more The total turnover of the UK private 250 - 499 sector Is estimated at £3,200 blllon **. 200 - 249 SMES generate 48.7% of this total. 100 - 199 Employment 50-99 By Industry SMES provide 59.1% of jobs. 20- 49 10 - 19 Enterprises 5-9 2-4 SMES account for 99.9% of the UK's private sector. Sole Trader By Region NorthEast North West Yorks hire and the Humber East Midlands West Midlands Turnover Employment Enterprises East of England Enterprises ILondon Other Service Activities Whilst construction accounts for 20% of all South East Arts, Entertainment and Recreation enterprises in the UK, wholesale and retail South West trade employ the largest percentage of people (21%). Human Health and Social Work Activities Wales Employment Education Scotland Administrative and Support Service Activities Northern Ireland Professional, Scientific and Technical Activities Of the data available for turnover***, wholesale and retail trade make the biggest Real Estate Acthvities London provides employment to the most people (15.8%) and contributes the highest proportlon of turnover (30.5%). contribution to turnover across all industries Turnover Financial and Insurance Activities 37% (estimated at £1,186 billion). Information and Communication Accommodation and Food Service Activities Transportation and Storage The South East has the largest number of enterprises (16.3% as compared to London's 15.8%). Wholesale and Retail Trade Construction Manufacturing Mining and Quarying Agriculture, Forestry and Fishing "As defined by the ONS (see Source). **Tumover estimates excludes VAT ***No data is provided for tumovérfrom financlal and Insurance activitles. Source: All data is taken from the Business Population Estimates for the UK and Reglons 2010 Issued by the Department for Business Innovation and Skills, published by the ONS. Detall here: http/ /stats.bis.gov.uk/ed/bpe/ SE Simply Business Turnover Employees Enterprises Profile of the UK Private Sector These graphs show a profile of the UK's private sector split by number of employees; region and industry type. By Size (employees) Turnover 500 - or more The total turnover of the UK private 250 - 499 sector Is estimated at £3,200 blllon **. 200 - 249 SMES generate 48.7% of this total. 100 - 199 Employment 50-99 By Industry SMES provide 59.1% of jobs. 20- 49 10 - 19 Enterprises 5-9 2-4 SMES account for 99.9% of the UK's 1 private sector. Sole Trader By Region NorthEast North West Yorks hire and the Humber East Midlands West Midlands Turnover Employment Enterprises East of England Enterprises ILondon Other Service Activities Whilst construction accounts for 20% of all South East Arts, Entertainment and Recreation enterprises in the UK, wholesale and retail South West trade employ the largest percentage of people (21%). Human Health and Social Work Activities Wales Employment Education Scotland Administrative and Support Service Activities Northern Ireland Professional, Scientific and Technical Activities Of the data available for turnover***, wholesale and retail trade make the biggest Real Estate Acthvities London provides employment to the most people (15.8%) and contributes the highest proportlon of turnover (30.5%). contribution to turnover across all industries Turnover Financial and Insurance Activities 37% (estimated at £1,186 billion). Information and Communication Accommodation and Food Service Activities Transportation and Storage The South East has the largest number of enterprises (16.3% as compared to London's 15.8%). Wholesale and Retail Trade Construction Manufacturing Mining and Quarying Agriculture, Forestry and Fishing "As defined by the ONS (see Source). **Tumover estimates excludes VAT ***No data is provided for tumovérfrom financlal and Insurance activitles. Source: All data is taken from the Business Population Estimates for the UK and Reglons 2010 Issued by the Department for Business Innovation and Skills, published by the ONS. Detall here: http/ /stats.bis.gov.uk/ed/bpe/ SE Simply Business Turnover Employees Enterprises Profile of the UK Private Sector These graphs show a profile of the UK's private sector split by number of employees; region and industry type. By Size (employees) Turnover 500 - or more The total turnover of the UK private 250 - 499 sector Is estimated at £3,200 blllon **. 200 - 249 SMES generate 48.7% of this total. 100 - 199 Employment 50-99 By Industry SMES provide 59.1% of jobs. 20- 49 10 - 19 Enterprises 5-9 2-4 SMES account for 99.9% of the UK's 1 private sector. Sole Trader By Region NorthEast North West Yorks hire and the Humber East Midlands West Midlands Turnover Employment Enterprises East of England Enterprises ILondon Other Service Activities Whilst construction accounts for 20% of all South East Arts, Entertainment and Recreation enterprises in the UK, wholesale and retail South West trade employ the largest percentage of people (21%). Human Health and Social Work Activities Wales Employment Education Scotland Administrative and Support Service Activities Northern Ireland Professional, Scientific and Technical Activities Of the data available for turnover***, wholesale and retail trade make the biggest Real Estate Acthvities London provides employment to the most people (15.8%) and contributes the highest proportlon of turnover (30.5%). contribution to turnover across all industries Turnover Financial and Insurance Activities 37% (estimated at £1,186 billion). Information and Communication Accommodation and Food Service Activities Transportation and Storage The South East has the largest number of enterprises (16.3% as compared to London's 15.8%). Wholesale and Retail Trade Construction Manufacturing Mining and Quarying Agriculture, Forestry and Fishing "As defined by the ONS (see Source). **Tumover estimates excludes VAT ***No data is provided for tumovérfrom financlal and Insurance activitles. Source: All data is taken from the Business Population Estimates for the UK and Reglons 2010 Issued by the Department for Business Innovation and Skills, published by the ONS. Detall here: http/ /stats.bis.gov.uk/ed/bpe/ SE Simply Business Turnover Employees Enterprises Profile of the UK Private Sector These graphs show a profile of the UK's private sector split by number of employees; region and industry type. By Size (employees) Turnover 500 - or more The total turnover of the UK private 250 - 499 sector Is estimated at £3,200 blllon **. 200 - 249 SMES generate 48.7% of this total. 100 - 199 Employment 50-99 By Industry SMES provide 59.1% of jobs. 20- 49 10 - 19 Enterprises 5-9 2-4 SMES account for 99.9% of the UK's 1 private sector. Sole Trader By Region NorthEast North West Yorks hire and the Humber East Midlands West Midlands Turnover Employment Enterprises East of England Enterprises ILondon Other Service Activities Whilst construction accounts for 20% of all South East Arts, Entertainment and Recreation enterprises in the UK, wholesale and retail South West trade employ the largest percentage of people (21%). Human Health and Social Work Activities Wales Employment Education Scotland Administrative and Support Service Activities Northern Ireland Professional, Scientific and Technical Activities Of the data available for turnover***, wholesale and retail trade make the biggest Real Estate Acthvities London provides employment to the most people (15.8%) and contributes the highest proportlon of turnover (30.5%). contribution to turnover across all industries Turnover Financial and Insurance Activities 37% (estimated at £1,186 billion). Information and Communication Accommodation and Food Service Activities Transportation and Storage The South East has the largest number of enterprises (16.3% as compared to London's 15.8%). Wholesale and Retail Trade Construction Manufacturing Mining and Quarying Agriculture, Forestry and Fishing "As defined by the ONS (see Source). **Tumover estimates excludes VAT ***No data is provided for tumovérfrom financlal and Insurance activitles. Source: All data is taken from the Business Population Estimates for the UK and Reglons 2010 Issued by the Department for Business Innovation and Skills, published by the ONS. Detall here: http/ /stats.bis.gov.uk/ed/bpe/ SE Simply Business Turnover Employees Enterprises Profile of the UK Private Sector These graphs show a profile of the UK's private sector split by number of employees; region and industry type. By Size (employees) Turnover 500 - or more The total turnover of the UK private 250 - 499 sector Is estimated at £3,200 blllon **. 200 - 249 SMES generate 48.7% of this total. 100 - 199 Employment 50-99 By Industry SMES provide 59.1% of jobs. 20- 49 10 - 19 Enterprises 5-9 2-4 SMES account for 99.9% of the UK's 1 private sector. Sole Trader By Region NorthEast North West Yorks hire and the Humber East Midlands West Midlands Turnover Employment Enterprises East of England Enterprises ILondon Other Service Activities Whilst construction accounts for 20% of all South East Arts, Entertainment and Recreation enterprises in the UK, wholesale and retail South West trade employ the largest percentage of people (21%). Human Health and Social Work Activities Wales Employment Education Scotland Administrative and Support Service Activities Northern Ireland Professional, Scientific and Technical Activities Of the data available for turnover***, wholesale and retail trade make the biggest Real Estate Acthvities London provides employment to the most people (15.8%) and contributes the highest proportlon of turnover (30.5%). contribution to turnover across all industries Turnover Financial and Insurance Activities 37% (estimated at £1,186 billion). Information and Communication Accommodation and Food Service Activities Transportation and Storage The South East has the largest number of enterprises (16.3% as compared to London's 15.8%). Wholesale and Retail Trade Construction Manufacturing Mining and Quarying Agriculture, Forestry and Fishing "As defined by the ONS (see Source). **Tumover estimates excludes VAT ***No data is provided for tumovérfrom financlal and Insurance activitles. Source: All data is taken from the Business Population Estimates for the UK and Reglons 2010 Issued by the Department for Business Innovation and Skills, published by the ONS. Detall here: http/ /stats.bis.gov.uk/ed/bpe/ SE Simply Business Turnover Employees Enterprises Profile of the UK Private Sector These graphs show a profile of the UK's private sector split by number of employees; region and industry type. By Size (employees) Turnover 500 - or more The total turnover of the UK private 250 - 499 sector Is estimated at £3,200 blllon **. 200 - 249 SMES generate 48.7% of this total. 100 - 199 Employment 50-99 By Industry SMES provide 59.1% of jobs. 20- 49 10 - 19 Enterprises 5-9 2-4 SMES account for 99.9% of the UK's 1 private sector. Sole Trader By Region NorthEast North West Yorks hire and the Humber East Midlands West Midlands Turnover Employment Enterprises East of England Enterprises ILondon Other Service Activities Whilst construction accounts for 20% of all South East Arts, Entertainment and Recreation enterprises in the UK, wholesale and retail South West trade employ the largest percentage of people (21%). Human Health and Social Work Activities Wales Employment Education Scotland Administrative and Support Service Activities Northern Ireland Professional, Scientific and Technical Activities Of the data available for turnover***, wholesale and retail trade make the biggest Real Estate Acthvities London provides employment to the most people (15.8%) and contributes the highest proportlon of turnover (30.5%). contribution to turnover across all industries Turnover Financial and Insurance Activities 37% (estimated at £1,186 billion). Information and Communication Accommodation and Food Service Activities Transportation and Storage The South East has the largest number of enterprises (16.3% as compared to London's 15.8%). Wholesale and Retail Trade Construction Manufacturing Mining and Quarying Agriculture, Forestry and Fishing "As defined by the ONS (see Source). **Tumover estimates excludes VAT ***No data is provided for tumovérfrom financlal and Insurance activitles. Source: All data is taken from the Business Population Estimates for the UK and Reglons 2010 Issued by the Department for Business Innovation and Skills, published by the ONS. Detall here: http/ /stats.bis.gov.uk/ed/bpe/ SE Simply Business Turnover Employees Enterprises Profile of the UK Private Sector These graphs show a profile of the UK's private sector split by number of employees; region and industry type. By Size (employees) Turnover 500 - or more The total turnover of the UK private 250 - 499 sector Is estimated at £3,200 blllon **. 200 - 249 SMES generate 48.7% of this total. 100 - 199 Employment 50-99 By Industry SMES provide 59.1% of jobs. 20- 49 10 - 19 Enterprises 5-9 2-4 SMES account for 99.9% of the UK's 1 private sector. Sole Trader By Region NorthEast North West Yorks hire and the Humber East Midlands West Midlands Turnover Employment Enterprises East of England Enterprises ILondon Other Service Activities Whilst construction accounts for 20% of all South East Arts, Entertainment and Recreation enterprises in the UK, wholesale and retail South West trade employ the largest percentage of people (21%). Human Health and Social Work Activities Wales Employment Education Scotland Administrative and Support Service Activities Northern Ireland Professional, Scientific and Technical Activities Of the data available for turnover***, wholesale and retail trade make the biggest Real Estate Acthvities London provides employment to the most people (15.8%) and contributes the highest proportlon of turnover (30.5%). contribution to turnover across all industries Turnover Financial and Insurance Activities 37% (estimated at £1,186 billion). Information and Communication Accommodation and Food Service Activities Transportation and Storage The South East has the largest number of enterprises (16.3% as compared to London's 15.8%). Wholesale and Retail Trade Construction Manufacturing Mining and Quarying Agriculture, Forestry and Fishing "As defined by the ONS (see Source). **Tumover estimates excludes VAT ***No data is provided for tumovérfrom financlal and Insurance activitles. Source: All data is taken from the Business Population Estimates for the UK and Reglons 2010 Issued by the Department for Business Innovation and Skills, published by the ONS. Detall here: http/ /stats.bis.gov.uk/ed/bpe/ SE Simply Business Turnover Employees Enterprises
Profile of the UK Private Sector
Source
Unknown. Add a sourceCategory
BusinessGet a Quote
You may also like...