

6 reasons to visualize your data
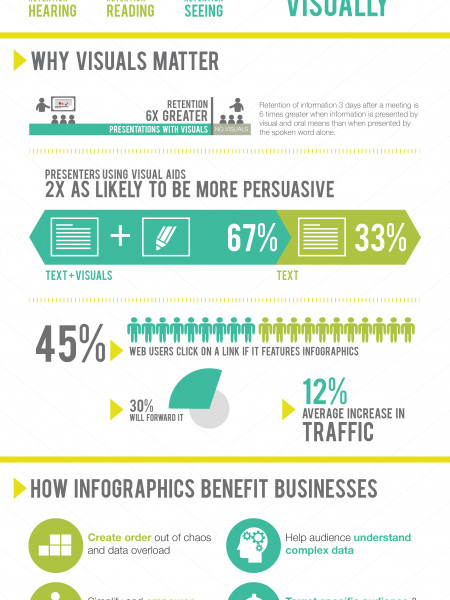
6 reasons to visualize your data People are suffering information OVERLOAD Long wordy reports & boring DIY charts take too much effort to interpret. Does this sound like your business? ABC The solution is data viz (data visualization or infographics) Lowm loeum dolor pit emet. cine elit sonesctete ned do alummpd 83 people remember 20% % of learning occurs of what they read only visually Images are memorable Images are easier to digest Colour, contrast, rhythm & shapes make complex data in graphics easily Infographics transform plain facts into visuals that are easy to understand. What data are you not Image vs Text remembered. Same reason why you remember TV ads. explaining clearly? Would you like people to remember your message but not have to pay big $$$ for a TV ad? Images are more appealing fe 4. Clever Infographics get infographics attract your shared eye, arouse interest, appeal to your curiosity, make you smile & compell you to absorb data. Clever infographics are shared on websites, I. blogs & social media. Print versions are shared in newspapers & magazines. This all generates valuable brand awareness (& boosts your SEO). Would you like to go viral? Does your data need to be more appealing? 100 Make you an industry leader awesome No matter how boring your industry, data viz can help EVERY business look like the leader. How could you use data viz in your business? Copyright 2011 j6 design Created by www.j6design.com.au j6 design Sources: http:/www.marketingtechblog.co "Presenting Effective Presentations with Visual Aids," U.S. Department of Labor, OSHA Office of Training and Education, May 1996 http://naldzgraphics.netitips/reasons-why-infographics-are-important gcom/why-use-infographics
6 reasons to visualize your data
Source
http://www.j...esign.aspxCategory
BusinessGet a Quote
You may also like...


![[Infographic] How to be a smarter Traveller Infographic](https://i.visual.ly/images/InfographicHowtobeasmarterTraveller_56bed507319df_w450_h300.png)


