The World's Leading Companies
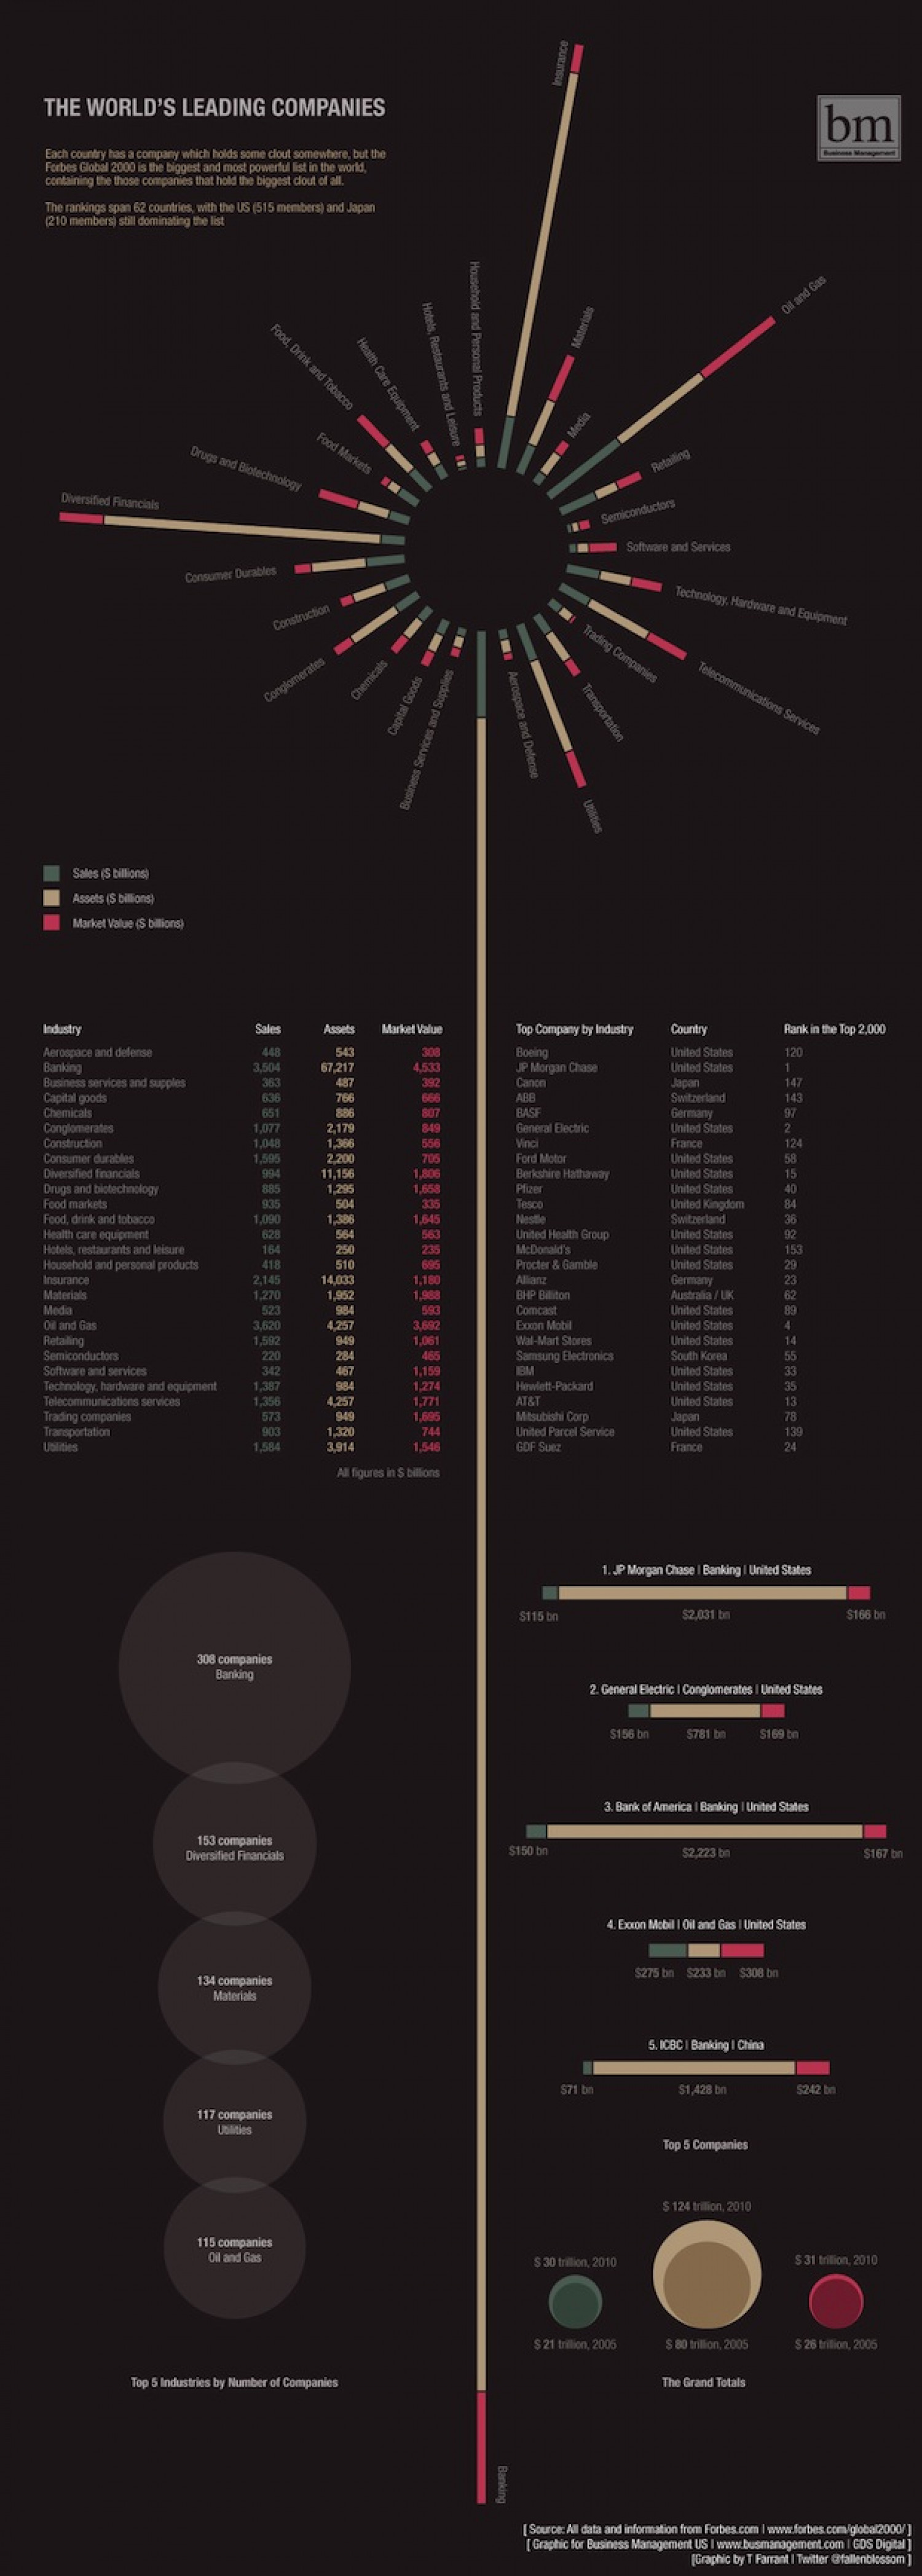
THE WORLD'S LEADING COMPANIES bm Each country has a company which holds some clout somewhere, but the Aatonne Mengement Forbes Global 2000 is the biggest and most powerful list in the world, containing the those companies that hold the biggest dout of all. The rankings span 62 countries, with the US (515 members) and Japan (210 members) still dominating the list Ol and Gas Food Markets Drugs and Biotechnology - Retailing Diversified Financials Semiconductos Software and Services Consumer Durables Technology, Hardware and Equipment Construction Trading Companies Telecommunications Services Conglomerates I Sales (S billions) Assets (S billions) IMarket Value (S billions) Industry Sales Assets Market Value Top Company by Industry Country Rank in the Top 2,000 448 Boeing JP Morgan Chase Canon ABB BASF General Electric Aerospace and defense 543 308 United States 120 Banking Business services and supples Capital goods Chemicals 3,504 363 636 651 67-217 4,533 United States 487 392 Japan Switzerland Germany United States 147 766 886 2,179 143 97 2 807 Conglomerates Construction 1,077 1,048 1,595 994 885 849 1,366 2.200 11,156 556 Vinci France 124 Consumer durables Diversified financials Drugs and biotechnology 705 1,806 1,658 Ford Motor Berkshire Hathaway Pfizer Tesco United States United States United States 58 15 40 1,295 504 Food markets 935 335 United Kingdom Switzerland United States United States United States 84 Food, drink and tobacco Health care equipment Hotels, restaurants and leisure 1,090 628 164 1.306 1,645 563 235 Nestle United Health Group McDonald's 36 564 92 250 153 29 23 Household and personal products 418 510 695 Procter & Gamble Germany Australia / UK United States United States United States South Korea Insurance 2,145 1,270 523 3.620 1.592 14,033 1.952 984 4.257 1,180 1,988 593 Alianz Materials Media Ol and Gas BHP Biliton Comcast 62 89 Eoon Mobil Wal-Mart Stores 4. 3,692 1,061 Retaling Semiconductors 949 14 220 284 465 Samsung Electronics 55 Software and services 342 1,387 467 984 1,159 1,274 BM United States Technology, hardware and equipment Telecommunications services Trading companies Transportation Ublities 33 35 13 78 Hewlett-Packard AT&T United States 1,356 4,257 1,771 1,695 United States Mitsubishi Corp United Parcel Service GDF Suez 573 949 1,320 3.914 Japan United States France 903 744 139 1,584 1,546 24 All figures in S billions 1. JP Morgan Chase Banking United States $115 bn $2.031 bn $166 bn 308 companies Banking 2. General Electric I Conglomerates United States $156 bn S781 bn S169 bn 3. Bank of America Banking I United States 153 companies Diversified Financials $150 bn $2,223 bn $167 bn 4. Exxon Mobil I Oil and Gas United States S275 bn S233 bn $308 bn 134 companies Materials 5. ICBC I Banking I China $71 bn $1,428 bn $242 bn 117 companies Ubities Top 5 Companies $ 124 trilion, 2010 115 companies Oil and Gas $30 trillion, 2010 $31 trillion, 2010 $21 trillion, 2006 $80 trillion, 2005 $ 26 trillion, 2005 Top 5 Industries by Number of Companies The Grand Totals (Source: All data and information from Forbes.com I www.forbes.com/global2000/] [Graphic for Business Management US I www.busmanagement.com GDS Digital] (Graphic by T Farrant I Teitter efallenblossom ] Heaith Care Eguipment Food, Drink and Tobacco Transportation ital Goods THE WORLD'S LEADING COMPANIES bm Each country has a company which holds some dlout somewhere, but the Forbes Global 2000 is the biggest and most powerful list in the world, containing the those companies that hold the biggest dout of all. Asinene Manment The rankings span 62 countries, with the US (515 members) and Japan (210 membersi still dominating the list Ol and Gas Food Markets Drugs and Biolechnology I - Retailing Diversified Financials Semiconductors Software and Services Consumer Durables Technology, Hardware and Equipment Construction -- I Trading Companies Telecommunications Services Conglomerates - ISales (S billions) Assets (S billions) I Market Value (S bilions) Industry Sales Assets Market Value Top Company by Industry Country Rank in the Top 2,000 Aerospace and defense Banking Business services and supples Capital goods Chemicals 448 Boeing JP Morgan Chase Cance United States United States Japan Switzerland 120 1 543 308 67,217 487 3,504 363 636 651 4,533 392 666 Canon ABB BASF General Electric 147 766 143 Germany United States 886 807 97 2 7 Conglomerates Construction 1,077 1,048 1.595 994 885 2,179 1,366 2,200 849 556 Vinci Ford Motor France 124 Consumer durables Diversified financials Drugs and biotechnology Food markets 705 1,806 1,658 United States United States United States 58 11,156 1,295 504 Berkshire Hathaway Plizer Tesco 15 40 84 935 335 Food, drink and tobacco Health care equipment Hotels, restaurants and leisure 1,090 628 164 418 United Kingdom Switzerland United States United States United States 1,386 1,645 563 Nestle United Health Group McDonald's 36 92 153 29 564 250 510 235 695 1,180 1,988 593 Household and personal products Procter & Gamble 14,033 1,952 984 Insurance Germany 2,145 1,270 523 Allianz 23 Materials Media BHP Biliton Comcast Eoon Mobil Wal-Mart Stores Australia / UK United States United States United States 62 89 4. O and Gas Retailing Semiconductors Software and services Technology, hardware and equipment Telecommunications services Trading companies Transportation Ublities 3,620 1.592 4,257 949 3,692 1,061 14 Samsung Electronics BM Hewlett-Packard AT&T South Korea United States 220 284 465 55 342 467 984 4,257 1,159 1,274 33 35 13 78 1,387 1,356 United States United States 1,771 1,695 Mitsubishi Corp United Parcel Service GDF Suez 573 949 Japan United States 1,320 3.914 903 744 139 24 1,584 1,546 France All figures in $ billions 1. JP Morgan Chase I Banking United States S115 bn $2.031 bn $166 bn 308 companies Banking 2. General Electric I Conglomerates I United States $156 bn S781 bo S169 bn 3. Bank of America I Banking I United States 153 companies Diversified Financials $150 bn $2,223 bn $167 bn 4. Exxon Mcbil Oil and Gas I United States S275 bn s233 bn $308 bn 134 companies Materials 5. ICBC I Banking I China S71 bn $1,428 bn $242 bn 117 companies Ublities Top 5 Companies $124 trillion, 2010 115 companies Oil and Gas $30 trillion, 2010 $31 trillion, 2010 $21 trillion, 2006 $ 80 trillion, 2005 $ 26 trilion, 2006 Top 5 Industries by Number of Companies The Grand Totals (Source: All data and information from Forbes.com I www.forbes.com/global2000/] [ Graphic for Business Management US I www.busmanagement.com GDS Digital] (Graphic by T Farrant I Teitter efallenblossom] Health Care Equipment Food, Drink and Tobacco -- Transportation Chemicals aoital Goods THE WORLD'S LEADING COMPANIES bm Each country has a company which holds some dlout somewhere, but the Forbes Global 2000 is the biggest and most powerful list in the world, containing the those companies that hold the biggest dout of all. Asinene Manment The rankings span 62 countries, with the US (515 members) and Japan (210 membersi still dominating the list Ol and Gas Food Markets Drugs and Biolechnology I - Retailing Diversified Financials Semiconductors Software and Services Consumer Durables Technology, Hardware and Equipment Construction -- I Trading Companies Telecommunications Services Conglomerates - ISales (S billions) Assets (S billions) I Market Value (S bilions) Industry Sales Assets Market Value Top Company by Industry Country Rank in the Top 2,000 Aerospace and defense Banking Business services and supples Capital goods Chemicals 448 Boeing JP Morgan Chase Cance United States United States Japan Switzerland 120 1 543 308 67,217 487 3,504 363 636 651 4,533 392 666 Canon ABB BASF General Electric 147 766 143 Germany United States 886 807 97 2 7 Conglomerates Construction 1,077 1,048 1.595 994 885 2,179 1,366 2,200 849 556 Vinci Ford Motor France 124 Consumer durables Diversified financials Drugs and biotechnology Food markets 705 1,806 1,658 United States United States United States 58 11,156 1,295 504 Berkshire Hathaway Plizer Tesco 15 40 84 935 335 Food, drink and tobacco Health care equipment Hotels, restaurants and leisure 1,090 628 164 418 United Kingdom Switzerland United States United States United States 1,386 1,645 563 Nestle United Health Group McDonald's 36 92 153 29 564 250 510 235 695 1,180 1,988 593 Household and personal products Procter & Gamble 14,033 1,952 984 Insurance Germany 2,145 1,270 523 Allianz 23 Materials Media BHP Biliton Comcast Eoon Mobil Wal-Mart Stores Australia / UK United States United States United States 62 89 4. O and Gas Retailing Semiconductors Software and services Technology, hardware and equipment Telecommunications services Trading companies Transportation Ublities 3,620 1.592 4,257 949 3,692 1,061 14 Samsung Electronics BM Hewlett-Packard AT&T South Korea United States 220 284 465 55 342 467 984 4,257 1,159 1,274 33 35 13 78 1,387 1,356 United States United States 1,771 1,695 Mitsubishi Corp United Parcel Service GDF Suez 573 949 Japan United States 1,320 3.914 903 744 139 24 1,584 1,546 France All figures in $ billions 1. JP Morgan Chase I Banking United States S115 bn $2.031 bn $166 bn 308 companies Banking 2. General Electric I Conglomerates I United States $156 bn S781 bo S169 bn 3. Bank of America I Banking I United States 153 companies Diversified Financials $150 bn $2,223 bn $167 bn 4. Exxon Mcbil Oil and Gas I United States S275 bn s233 bn $308 bn 134 companies Materials 5. ICBC I Banking I China S71 bn $1,428 bn $242 bn 117 companies Ublities Top 5 Companies $124 trillion, 2010 115 companies Oil and Gas $30 trillion, 2010 $31 trillion, 2010 $21 trillion, 2006 $ 80 trillion, 2005 $ 26 trilion, 2006 Top 5 Industries by Number of Companies The Grand Totals (Source: All data and information from Forbes.com I www.forbes.com/global2000/] [ Graphic for Business Management US I www.busmanagement.com GDS Digital] (Graphic by T Farrant I Teitter efallenblossom] Health Care Equipment Food, Drink and Tobacco -- Transportation Chemicals aoital Goods THE WORLD'S LEADING COMPANIES bm Each country has a company which holds some dlout somewhere, but the Forbes Global 2000 is the biggest and most powerful list in the world, containing the those companies that hold the biggest dout of all. Asinene Manment The rankings span 62 countries, with the US (515 members) and Japan (210 membersi still dominating the list Ol and Gas Food Markets Drugs and Biolechnology I - Retailing Diversified Financials Semiconductors Software and Services Consumer Durables Technology, Hardware and Equipment Construction -- I Trading Companies Telecommunications Services Conglomerates - ISales (S billions) Assets (S billions) I Market Value (S bilions) Industry Sales Assets Market Value Top Company by Industry Country Rank in the Top 2,000 Aerospace and defense Banking Business services and supples Capital goods Chemicals 448 Boeing JP Morgan Chase Cance United States United States Japan Switzerland 120 1 543 308 67,217 487 3,504 363 636 651 4,533 392 666 Canon ABB BASF General Electric 147 766 143 Germany United States 886 807 97 2 7 Conglomerates Construction 1,077 1,048 1.595 994 885 2,179 1,366 2,200 849 556 Vinci Ford Motor France 124 Consumer durables Diversified financials Drugs and biotechnology Food markets 705 1,806 1,658 United States United States United States 58 11,156 1,295 504 Berkshire Hathaway Plizer Tesco 15 40 84 935 335 Food, drink and tobacco Health care equipment Hotels, restaurants and leisure 1,090 628 164 418 United Kingdom Switzerland United States United States United States 1,386 1,645 563 Nestle United Health Group McDonald's 36 92 153 29 564 250 510 235 695 1,180 1,988 593 Household and personal products Procter & Gamble 14,033 1,952 984 Insurance Germany 2,145 1,270 523 Allianz 23 Materials Media BHP Biliton Comcast Eoon Mobil Wal-Mart Stores Australia / UK United States United States United States 62 89 4. O and Gas Retailing Semiconductors Software and services Technology, hardware and equipment Telecommunications services Trading companies Transportation Ublities 3,620 1.592 4,257 949 3,692 1,061 14 Samsung Electronics BM Hewlett-Packard AT&T South Korea United States 220 284 465 55 342 467 984 4,257 1,159 1,274 33 35 13 78 1,387 1,356 United States United States 1,771 1,695 Mitsubishi Corp United Parcel Service GDF Suez 573 949 Japan United States 1,320 3.914 903 744 139 24 1,584 1,546 France All figures in $ billions 1. JP Morgan Chase I Banking United States S115 bn $2.031 bn $166 bn 308 companies Banking 2. General Electric I Conglomerates I United States $156 bn S781 bo S169 bn 3. Bank of America I Banking I United States 153 companies Diversified Financials $150 bn $2,223 bn $167 bn 4. Exxon Mcbil Oil and Gas I United States S275 bn s233 bn $308 bn 134 companies Materials 5. ICBC I Banking I China S71 bn $1,428 bn $242 bn 117 companies Ublities Top 5 Companies $124 trillion, 2010 115 companies Oil and Gas $30 trillion, 2010 $31 trillion, 2010 $21 trillion, 2006 $ 80 trillion, 2005 $ 26 trilion, 2006 Top 5 Industries by Number of Companies The Grand Totals (Source: All data and information from Forbes.com I www.forbes.com/global2000/] [ Graphic for Business Management US I www.busmanagement.com GDS Digital] (Graphic by T Farrant I Teitter efallenblossom] Health Care Equipment Food, Drink and Tobacco -- Transportation Chemicals aoital Goods THE WORLD'S LEADING COMPANIES bm Each country has a company which holds some dlout somewhere, but the Forbes Global 2000 is the biggest and most powerful list in the world, containing the those companies that hold the biggest dout of all. Asinene Manment The rankings span 62 countries, with the US (515 members) and Japan (210 membersi still dominating the list Ol and Gas Food Markets Drugs and Biolechnology I - Retailing Diversified Financials Semiconductors Software and Services Consumer Durables Technology, Hardware and Equipment Construction -- I Trading Companies Telecommunications Services Conglomerates - ISales (S billions) Assets (S billions) I Market Value (S bilions) Industry Sales Assets Market Value Top Company by Industry Country Rank in the Top 2,000 Aerospace and defense Banking Business services and supples Capital goods Chemicals 448 Boeing JP Morgan Chase Cance United States United States Japan Switzerland 120 1 543 308 67,217 487 3,504 363 636 651 4,533 392 666 Canon ABB BASF General Electric 147 766 143 Germany United States 886 807 97 2 7 Conglomerates Construction 1,077 1,048 1.595 994 885 2,179 1,366 2,200 849 556 Vinci Ford Motor France 124 Consumer durables Diversified financials Drugs and biotechnology Food markets 705 1,806 1,658 United States United States United States 58 11,156 1,295 504 Berkshire Hathaway Plizer Tesco 15 40 84 935 335 Food, drink and tobacco Health care equipment Hotels, restaurants and leisure 1,090 628 164 418 United Kingdom Switzerland United States United States United States 1,386 1,645 563 Nestle United Health Group McDonald's 36 92 153 29 564 250 510 235 695 1,180 1,988 593 Household and personal products Procter & Gamble 14,033 1,952 984 Insurance Germany 2,145 1,270 523 Allianz 23 Materials Media BHP Biliton Comcast Eoon Mobil Wal-Mart Stores Australia / UK United States United States United States 62 89 4. O and Gas Retailing Semiconductors Software and services Technology, hardware and equipment Telecommunications services Trading companies Transportation Ublities 3,620 1.592 4,257 949 3,692 1,061 14 Samsung Electronics BM Hewlett-Packard AT&T South Korea United States 220 284 465 55 342 467 984 4,257 1,159 1,274 33 35 13 78 1,387 1,356 United States United States 1,771 1,695 Mitsubishi Corp United Parcel Service GDF Suez 573 949 Japan United States 1,320 3.914 903 744 139 24 1,584 1,546 France All figures in $ billions 1. JP Morgan Chase I Banking United States S115 bn $2.031 bn $166 bn 308 companies Banking 2. General Electric I Conglomerates I United States $156 bn S781 bo S169 bn 3. Bank of America I Banking I United States 153 companies Diversified Financials $150 bn $2,223 bn $167 bn 4. Exxon Mcbil Oil and Gas I United States S275 bn s233 bn $308 bn 134 companies Materials 5. ICBC I Banking I China S71 bn $1,428 bn $242 bn 117 companies Ublities Top 5 Companies $124 trillion, 2010 115 companies Oil and Gas $30 trillion, 2010 $31 trillion, 2010 $21 trillion, 2006 $ 80 trillion, 2005 $ 26 trilion, 2006 Top 5 Industries by Number of Companies The Grand Totals (Source: All data and information from Forbes.com I www.forbes.com/global2000/] [ Graphic for Business Management US I www.busmanagement.com GDS Digital] (Graphic by T Farrant I Teitter efallenblossom] Health Care Equipment Food, Drink and Tobacco -- Transportation Chemicals aoital Goods THE WORLD'S LEADING COMPANIES bm Each country has a company which holds some dlout somewhere, but the Forbes Global 2000 is the biggest and most powerful list in the world, containing the those companies that hold the biggest dout of all. Asinene Manment The rankings span 62 countries, with the US (515 members) and Japan (210 membersi still dominating the list Ol and Gas Food Markets Drugs and Biolechnology I - Retailing Diversified Financials Semiconductors Software and Services Consumer Durables Technology, Hardware and Equipment Construction -- I Trading Companies Telecommunications Services Conglomerates - ISales (S billions) Assets (S billions) I Market Value (S bilions) Industry Sales Assets Market Value Top Company by Industry Country Rank in the Top 2,000 Aerospace and defense Banking Business services and supples Capital goods Chemicals 448 Boeing JP Morgan Chase Cance United States United States Japan Switzerland 120 1 543 308 67,217 487 3,504 363 636 651 4,533 392 666 Canon ABB BASF General Electric 147 766 143 Germany United States 886 807 97 2 7 Conglomerates Construction 1,077 1,048 1.595 994 885 2,179 1,366 2,200 849 556 Vinci Ford Motor France 124 Consumer durables Diversified financials Drugs and biotechnology Food markets 705 1,806 1,658 United States United States United States 58 11,156 1,295 504 Berkshire Hathaway Plizer Tesco 15 40 84 935 335 Food, drink and tobacco Health care equipment Hotels, restaurants and leisure 1,090 628 164 418 United Kingdom Switzerland United States United States United States 1,386 1,645 563 Nestle United Health Group McDonald's 36 92 153 29 564 250 510 235 695 1,180 1,988 593 Household and personal products Procter & Gamble 14,033 1,952 984 Insurance Germany 2,145 1,270 523 Allianz 23 Materials Media BHP Biliton Comcast Eoon Mobil Wal-Mart Stores Australia / UK United States United States United States 62 89 4. O and Gas Retailing Semiconductors Software and services Technology, hardware and equipment Telecommunications services Trading companies Transportation Ublities 3,620 1.592 4,257 949 3,692 1,061 14 Samsung Electronics BM Hewlett-Packard AT&T South Korea United States 220 284 465 55 342 467 984 4,257 1,159 1,274 33 35 13 78 1,387 1,356 United States United States 1,771 1,695 Mitsubishi Corp United Parcel Service GDF Suez 573 949 Japan United States 1,320 3.914 903 744 139 24 1,584 1,546 France All figures in $ billions 1. JP Morgan Chase I Banking United States S115 bn $2.031 bn $166 bn 308 companies Banking 2. General Electric I Conglomerates I United States $156 bn S781 bo S169 bn 3. Bank of America I Banking I United States 153 companies Diversified Financials $150 bn $2,223 bn $167 bn 4. Exxon Mcbil Oil and Gas I United States S275 bn s233 bn $308 bn 134 companies Materials 5. ICBC I Banking I China S71 bn $1,428 bn $242 bn 117 companies Ublities Top 5 Companies $124 trillion, 2010 115 companies Oil and Gas $30 trillion, 2010 $31 trillion, 2010 $21 trillion, 2006 $ 80 trillion, 2005 $ 26 trilion, 2006 Top 5 Industries by Number of Companies The Grand Totals (Source: All data and information from Forbes.com I www.forbes.com/global2000/] [ Graphic for Business Management US I www.busmanagement.com GDS Digital] (Graphic by T Farrant I Teitter efallenblossom] Health Care Equipment Food, Drink and Tobacco -- Transportation Chemicals aoital Goods THE WORLD'S LEADING COMPANIES bm Each country has a company which holds some dlout somewhere, but the Forbes Global 2000 is the biggest and most powerful list in the world, containing the those companies that hold the biggest dout of all. Asinene Manment The rankings span 62 countries, with the US (515 members) and Japan (210 membersi still dominating the list Ol and Gas Food Markets Drugs and Biolechnology I - Retailing Diversified Financials Semiconductors Software and Services Consumer Durables Technology, Hardware and Equipment Construction -- I Trading Companies Telecommunications Services Conglomerates - ISales (S billions) Assets (S billions) I Market Value (S bilions) Industry Sales Assets Market Value Top Company by Industry Country Rank in the Top 2,000 Aerospace and defense Banking Business services and supples Capital goods Chemicals 448 Boeing JP Morgan Chase Cance United States United States Japan Switzerland 120 1 543 308 67,217 487 3,504 363 636 651 4,533 392 666 Canon ABB BASF General Electric 147 766 143 Germany United States 886 807 97 2 7 Conglomerates Construction 1,077 1,048 1.595 994 885 2,179 1,366 2,200 849 556 Vinci Ford Motor France 124 Consumer durables Diversified financials Drugs and biotechnology Food markets 705 1,806 1,658 United States United States United States 58 11,156 1,295 504 Berkshire Hathaway Plizer Tesco 15 40 84 935 335 Food, drink and tobacco Health care equipment Hotels, restaurants and leisure 1,090 628 164 418 United Kingdom Switzerland United States United States United States 1,386 1,645 563 Nestle United Health Group McDonald's 36 92 153 29 564 250 510 235 695 1,180 1,988 593 Household and personal products Procter & Gamble 14,033 1,952 984 Insurance Germany 2,145 1,270 523 Allianz 23 Materials Media BHP Biliton Comcast Eoon Mobil Wal-Mart Stores Australia / UK United States United States United States 62 89 4. O and Gas Retailing Semiconductors Software and services Technology, hardware and equipment Telecommunications services Trading companies Transportation Ublities 3,620 1.592 4,257 949 3,692 1,061 14 Samsung Electronics BM Hewlett-Packard AT&T South Korea United States 220 284 465 55 342 467 984 4,257 1,159 1,274 33 35 13 78 1,387 1,356 United States United States 1,771 1,695 Mitsubishi Corp United Parcel Service GDF Suez 573 949 Japan United States 1,320 3.914 903 744 139 24 1,584 1,546 France All figures in $ billions 1. JP Morgan Chase I Banking United States S115 bn $2.031 bn $166 bn 308 companies Banking 2. General Electric I Conglomerates I United States $156 bn S781 bo S169 bn 3. Bank of America I Banking I United States 153 companies Diversified Financials $150 bn $2,223 bn $167 bn 4. Exxon Mcbil Oil and Gas I United States S275 bn s233 bn $308 bn 134 companies Materials 5. ICBC I Banking I China S71 bn $1,428 bn $242 bn 117 companies Ublities Top 5 Companies $124 trillion, 2010 115 companies Oil and Gas $30 trillion, 2010 $31 trillion, 2010 $21 trillion, 2006 $ 80 trillion, 2005 $ 26 trilion, 2006 Top 5 Industries by Number of Companies The Grand Totals (Source: All data and information from Forbes.com I www.forbes.com/global2000/] [ Graphic for Business Management US I www.busmanagement.com GDS Digital] (Graphic by T Farrant I Teitter efallenblossom] Health Care Equipment Food, Drink and Tobacco -- Transportation Chemicals aoital Goods
The World's Leading Companies

Source
Unknown. Add a sourceCategory
BusinessGet a Quote
You may also like...