World of CO2
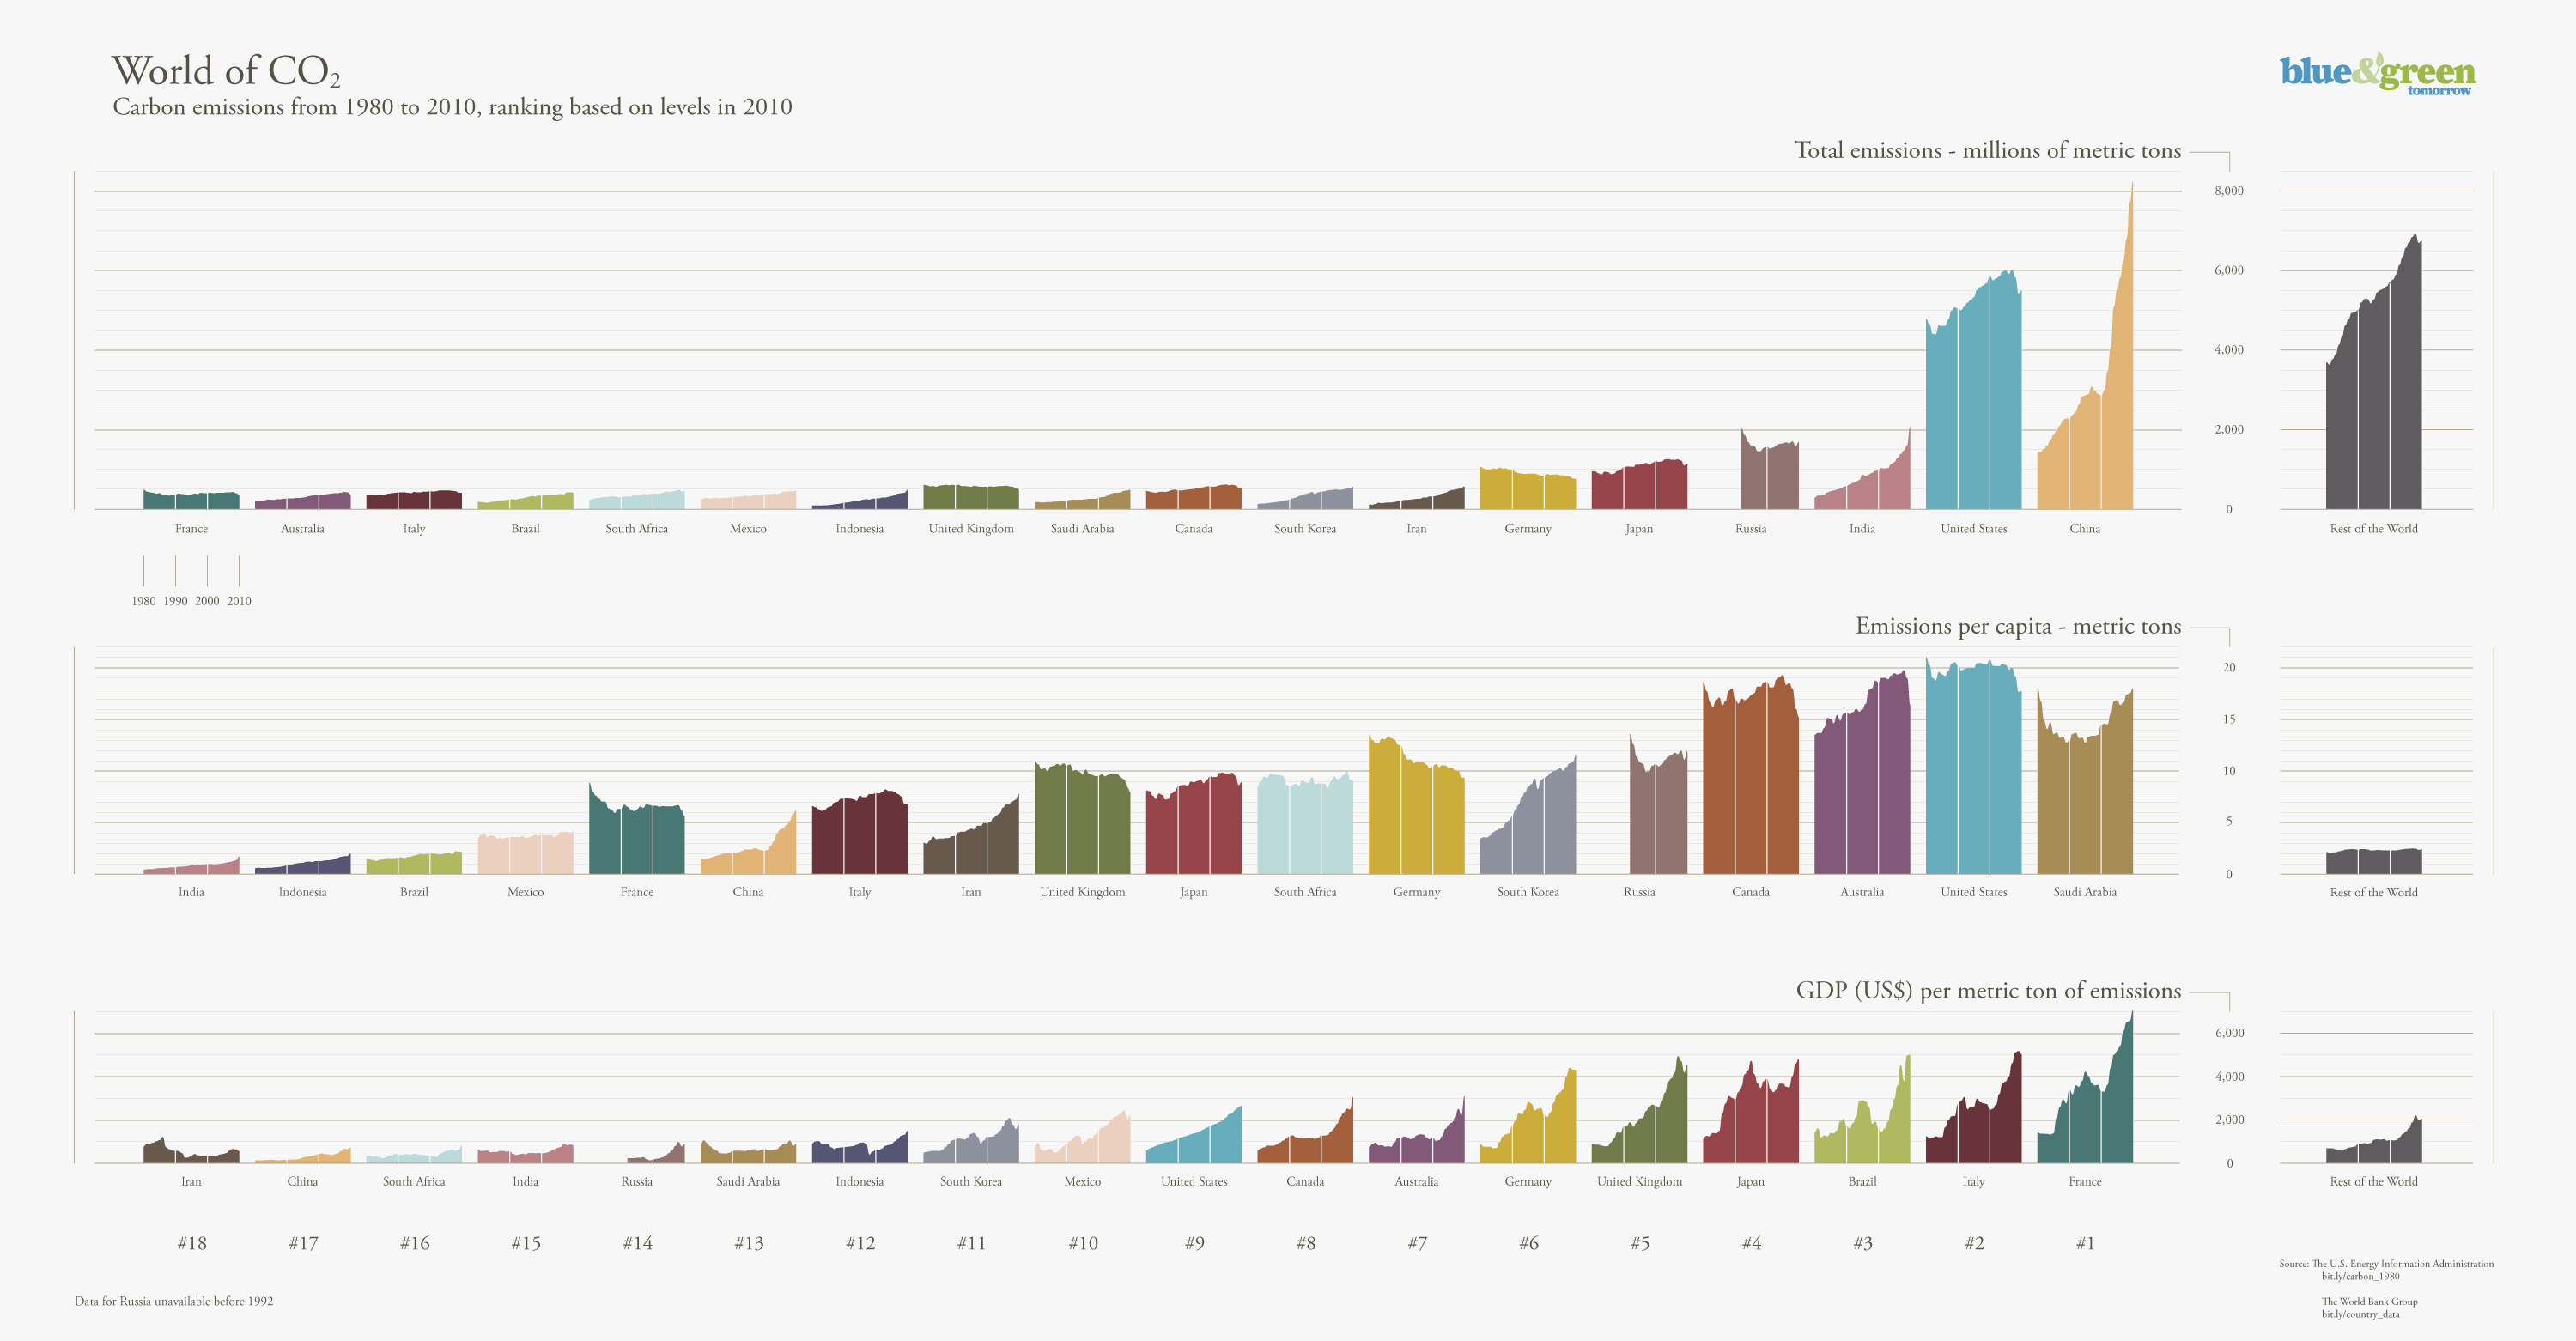
World of CO2 blue &green tomorrow Carbon emissions from 1980 to 2010, ranking based on levels in 2010 Total emissions millions of metric tons ৪,000 6,000 4,000 2,000 France Australia Italy Brazil South Africa Mexico Indonesia United Kingdom Saudi Arabia Canada South Korea Iran Germany Japan Russia India United States China Rest of the World 1980 1990 2000 2010 Emissions per capita metric tons 20 15 10 India Indonesia Brazil Mexico France China Italy Iran United Kingdom Japan South Africa Germany South Korea Russia Canada Australia United States Saudi Arabia Rest of the World GDP (US$) per metric ton of emissions 6,000 4,000 2,000 Iran China South Africa India Russia Saudi Arabia Indonesia South Korea Mexico United States Canada Australia Germany United Kingdom Japan Brazil Italy Rest of the World France #18 #17 #16 #15 #14 #13 #12 #11 #10 #9 # 8 #7 #6 #5 # 4 #2 #1 Source: The U.S. Energy Information Administration bit.ly/carbon_1980 Data for Russia unavailable before 1992 The World Bank Group bit.ly/country_data
World of CO2
Source
http://bluea...-analysis/Category
EnvironmentGet a Quote


