What's Behind These Gas Prices?
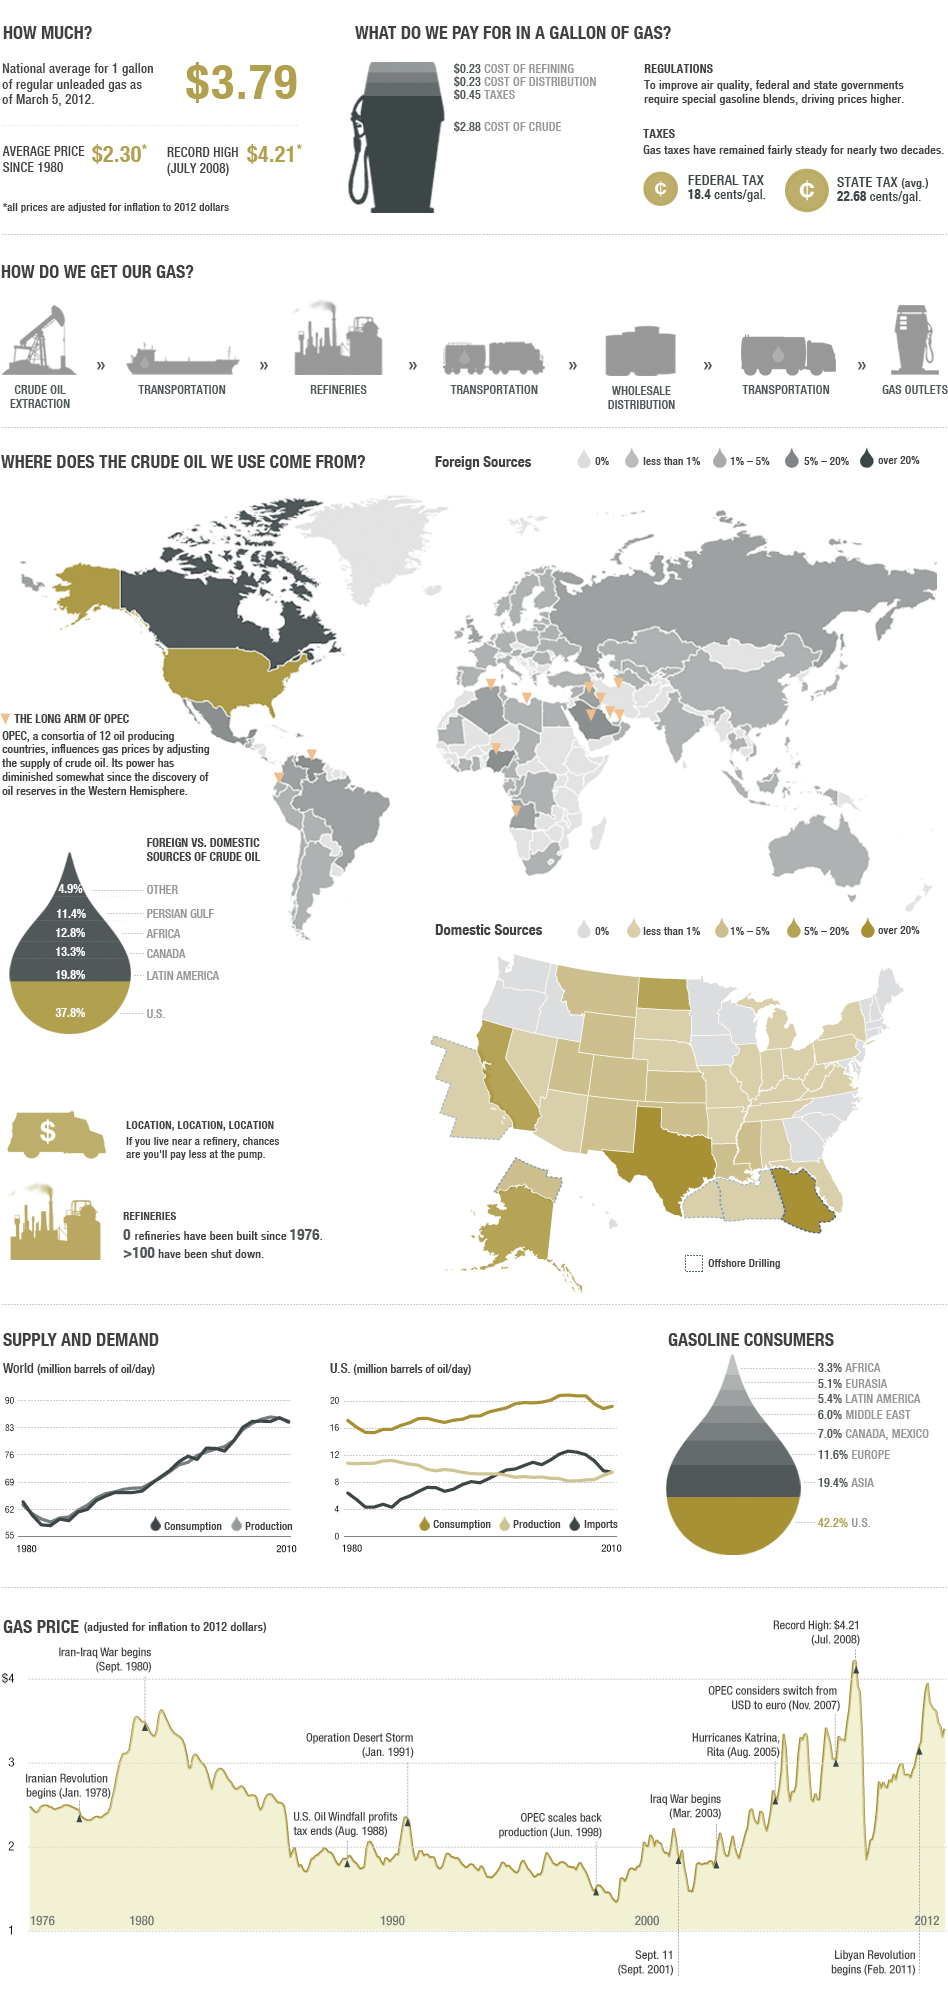
HOW MUCH? WHAT DO WE PAY FOR IN A GALLON OF GAS? National average for 1 gallon of regular unleaded gas as of March 5, 2012. $3.79 $0.23 COST OF REFINING $0.23 COST OF DISTRIBUTION $0.45 TAXES REGULATIONS To improve air quality, federal and state governments require special gasoline blends, driving prices higher. $2.88 COST OF CRUDE TAXES AVERAGE PRICE $2.30* RECORD HIGH $4.21* SINCE 1980 Gas taxes have remained fairly steady for nearly two decades. (JULY 2008) FEDERAL TAX STATE TAX (avg.) 22.68 cents/gal. 18.4 cents/gal. *all prices are adjusted for inflation to 2012 dollars HOW DO WE GET OUR GAS? >> >> >> >> >> TRANSPORTATION CRUDE OIL EXTRACTION TRANSPORTATION REFINERIES TRANSPORTATION WHOLESALE GAS OUTLETS DISTRIBUTION WHERE DOES THE CRUDE OIL WE USE COME FROM? Foreign Sources less than 1% 5% - 20% over 20% 0% 1% - 5% V THE LONG ARM OF OPEC OPEC, a consortia of 12 oil producing countries, influences gas prices by adjusting the supply of crude oil. Its power has diminished somewhat since the discovery of oil reserves in the Western Hemisphere. FOREIGN VS. DOMESTIC SOURCES OF CRUDE OIL 4.9% OTHER 11.4% PERSIAN GULF 12.8% AFRICA Domestic Sources 0% less than 1% 1% - 5% 5% - 20% over 20% 13.3% CANADA 19.8% . LATIN AMERICA 37.8% U.S. LOCATION, LOCATION, LOCATION If you live near a refinery, chances are you'll pay less at the pump. REFINERIES O refineries have been built since 1976. >100 have been shut down. Offshore Drilling SUPPLY AND DEMAND GASOLINE CONSUMERS World (million barrels of oil/day) U.S. (million barrels of oil/day) 3.3% AFRICA 5.1% EURASIA 90 20 5.4% LATIN AMERICA 6.0% MIDDLE EAST 83 16 7.0% CANADA, MEXICO 76 12 11.6% EUROPE 69 19.4% ASIA 62 O Consumption Production Consumption Production Imports 42.2% U.S. 55 1980 2010 1980 2010 GAS PRICE (adjusted for inflation to 2012 dollars) Record High: $4.21 (Jul. 2008) Iran-Iraq War begins (Sept. 1980) $4 OPEC considers switch from USD to euro (Nov. 2007) Operation Desert Storm (Jan. 1991) Hurricanes Katrina, Rita (Aug. 2005) Iranian Revolution begins (Jan. 1978)/ Iraq War begins (Mar. 2003) US. Oil Windfall profits OPEC scales back wtho tax ends (Aug. 1988) production (Jun. 1998) 2 1976 1980 1990 2000 2012 Sept. 11 (Sept. 2001) Libyan Revolution begins (Feb. 2011)
What's Behind These Gas Prices?
Source
http://www.n...gas-pricesCategory
EconomyGet a Quote


