
Transcribed
Power sector gross revenues and operating costs by scenario, 2012-2035
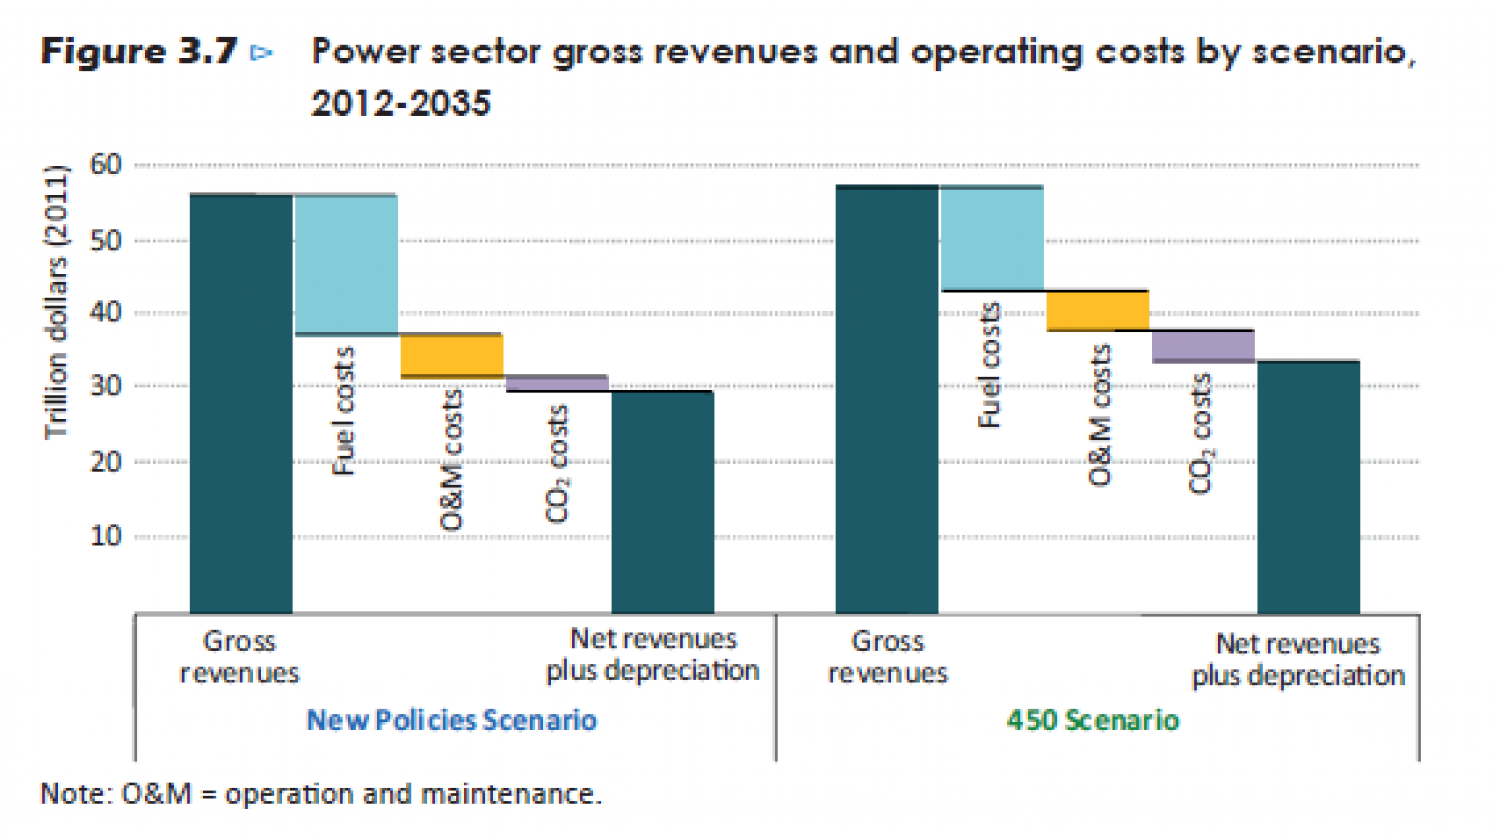
Figure 3.7 Power sector gross revenues and operating costs by scenario, 2012-2035 60 50 40 ....... 30 20 10 Net revenues plus depreciation Gross Gross Net revenues revenues revenues plus depreciation New Policies Scenario 450 Scenario Note: 0&M = operation and maintenance. Trillion dollars (2011) Fuel costs O&M costs CO2 costs Fuel costs O&M costs CO, costs
Power sector gross revenues and operating costs by scenario, 2012-2035
shared by W.E.R.I on Jul 12
83
views
0
faves
0
comments
On a consistent basis across scenarios, gross revenues in the power sector (from 2012 to
2035) are $1.3 trillion (in year-2011 dollars) higher in the 450 Scenario than in the New
Policies Scenario (...
Figure 3.7). The higher gross revenues result from a combination of
lower electricity demand and higher electricity prices, with the larger effect proving slightly
larger.8 Over the projection period, total electricity generation is nearly 60 000 Twh, or
8%, lower in the 450 Scenario than in the New Policies Scenario, a reduction equivalent to
almost three times annual world generation in 2010, but wholesale electricity prices are
16% higher, on average, in 2035. The change in electricity prices results from a combination
of lower fossil-fuel prices, higher overall CO2 costs (higher and more widespread CO2 prices
but lower levels of CO2 emissions in the 450 Scenario) and capacity additions that are
more capital intensive. Operation and maintenance (O&M) costs are similar across the two
scenarios, as the reduction in costs that comes from phasing out some fossil-fuel plants
are offset by increased reliance on technologies with higher maintenance costs per unit of
capacity, such as CCS and nuclear.
For all power generation capacity, net revenues before accountting for depreciation
("net revenues plus depreciation in Figure 3.7) are $4.3 trillion higher in the
450 Scenario than in the New Policies Scenario. These revenues essentially provide for
the recovery of investment costs and a financial return on investment.10 Depreciation
costs for new capacity are $1.4 trillion higher in the 450 Scenario than the New Policies
Scenario, as this scenario requires more generating capacity to be built to offset the
lower utilisation factor of many renewables compared to the fossil alternative and
generally more capital-intensive technologies. This additional cost is more than offset
by lower fuel and O&M costs, which are $4.5 trillion (19%) lower than in the New
Policies Scenario through to 2035. This is due to lower electricity demand, lower fossilfuel
prices and a more marked transition to renewables and nuclear with low or no
fuel costs. CO2 costs are $1.5 trillion higher in the 450 Scenario, with prices reaching
$95-120 per tonne in many regions in 2035. While higher CO2 prices increase wholesale
electricity prices (and therefore consumer bills), this revenue can potentially be recycled
back to consumers in ways that partially offset the economic impact of electricity price
rises, without compromising climate policy outcomes.
For existing power generation capacity, net revenues before accounting for depreciation are
at similar levels in the 450 Scenario and the New Policies Scenario, at around $15.6 trillion.
In the 450 Scenario, net revenues increase by around $900 billion each for both existing
nuclear and renewables capacity (that receive the market price in liberalised markets),
compared with the New Policies Scenario (Figure 3.8). This gain offsets a similar loss in
net revenues by fossil-fuel plants of $1.9 trillion. Coal power plants without CCS bear the
burden of the relative revenue reductions in the 450 Scenario, as rising CO2 costs and
reduced operating hours outweigh the impact of lower fossil-fuel prices, and power plants
with higher emissions are more affected than those with lower emissions. Net revenues
from gas-fired power plants increase slightly overall in the 450 Scenario, compared with the
New Policies Scenario, with higher revenues from more efficient power plants, and some
coal to gas substitution, more than offseting lower revenues from less efficient gas plants.
Note: O&M = operation and maintenance.
Source
Unknown. Add a sourceCategory
EnvironmentGet a Quote


