Obesity In America, By The Numbers
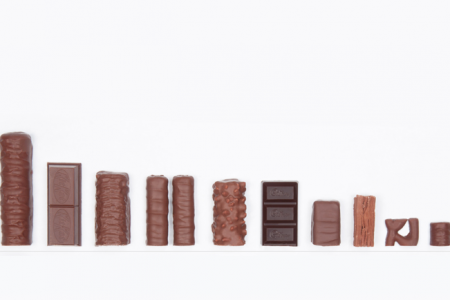
72 MILLION THE UNITED STATES In 2010, more than 60 percent of the United States was overweight or obese, It is estimated that if the current trend continues, 50 percent of the population will be obese by 2030. OBESITY RATES THE COST STATE OBESITY RATES VS. STATE POVERTY RATES THE COST OF BEING AN OBESE INDIVIDUAL 1990 Vs. 2009 State Obesity Rates The amount of money lost annually as a result of being obese Total Losses By Gender I Women – $4,879 15%-19% 20%-24% 25%-29% >30% I Men - $2,644 Breakdown $1,474 $1,474 Medical costs | S0 Salary and wages $1,855 $389 $307 Short-term disability Disability pension $69 S69 $212 Sick leave $674 $358 $358 2009 Poverty Rates Productivity MISSISSIPPI I <11% I 11%-13% 13%-16% >16% $23 $21 Fuel for cars Has the highest obesity rate in the United States and is also the state with the highest percentage of its population living in poverty $121 $121 Life insurance States With The Highest Obesity Rates States With The Lowest Obesity Rates Colorado - 18.6% Mississippi - 34.4% THE TYPICAL REVOLVING DOOR HAD TO BE WIDENED FROM 10 FEET TO 12 FEET District of Columbia - 19.7% Louisiana - 33% Connecticut - 20.6% Tennessee - 32.3% PORTION SIZES EATING HABITS CHANGING PORTION SIZES IN AMERICA AMERICANS ARE DRINKING LESS MILK, EATING MORE CHEESE Annual Milk Consumption, per capita Annual American Cheese Consumption, per capita Movie Popcorn Hershey Bar The current milk trend is toward low-fat milk as opposed to whole milk, which represented 92 percent of milk consumption in the 1950s but in 2000 represented only 36 percent. 1900 1950s - 7.7 pounds 2 ounces 297 calories 1950 2004 I Whole milk I Skim milk 3 cups 2011 2000 - 29.8 pounds 1950s - 36.4 gallons 21 cups (buttered) 174 calories 1, 700 calories 7 ounces 900 calories 287% 38% FAST FOOD 2000 - 22.6 gallons FAST-FOOD SALES, IN BILLIONS Increase in annual cheese consumption since the 1950s Decrease in annual milk consumption since the 1950s 2000 S107.147 2010 $164.836 AMERICANS ARE EATING MORE MEAT AND FEWER EGGS In 2000, Americans consumed an average of 57 pounds more meat per capita than they did annually in the 1950s, and a third fewer eggs. SWEET TOOTH 1950s 2000 America's sugar consumption increased by 39 percent between the 1950s and 2000 Each animal equals 5 pounds per capita BEEF Teaspoons of added sugars Americans are advised not d daily 20 52.8 pounds 10 b excee o Teaspoons of added sugars Americans actually consume 64.4 pounds 1950 - 1959 PORK Total Caloric Sweeteners - 109.6 pounds, per capita, annually 45.4 pounds 47.7 pounds 0 pounds - High fructose com syrup 7.4 pounds - Glucose LAMB / VEAL 8.5 pounds 96.7 pounds 3.5 pounds - Dextrose Cane and 1.4 pounds beet sugar 2.0 pounds - 0ther POULTRY 16.4 pounds 52.9 pounds 2000 TURKEY Total Caloric Sweeteners - 152.4 pounds, per capita, annually 4.1 pounds 13.6 pounds 63.8 pounds High fructose corn syrup EG Each egg equals 10 eggs per capita 18.1 pounds - Glucose 0000 000 374 eggs 3.4 pounds-Dextrose 65.6 pounds Cane and beet sugar 1.5 pounds - Other 250 eggs
Obesity In America, By The Numbers
Source
Unknown. Add a sourceCategory
HealthGet a Quote
You may also like...