Transcribed
Malaysia - Trade Indicators
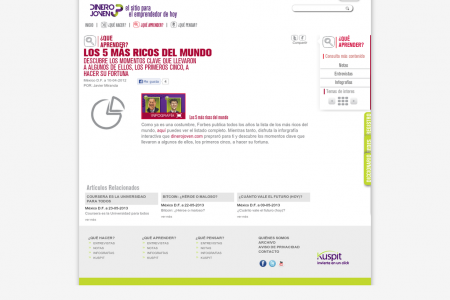
3.26.5 Trade indicators Export growth Import growth Trade balance $ billion - 60 45- 30_ - 40 15- – 20 - 0_J -15- --20 -30- --40 2008 2009 2010 2011 2012 Source: Asian Development Outlook database. 3.26.5 Trade indicators Export growth Import growth Trade balance $ billion - 60 45- 30_ - 40 15- – 20 - 0_J -15- --20 -30- --40 2008 2009 2010 2011 2012 Source: Asian Development Outlook database.
Malaysia - Trade Indicators
shared by PARMIONOVA on Apr 24
118
views
0
faves
0
comments
Merchandise exports fell marginally to $227.6 billion as a consequence of sluggish demand in global markets and soft prices for
export commodities such as rubber and palm oil. Exports of electronics
f...
ell, but not as quickly as in 2011. Commodity exports declined by about
7%. By contrast imports rose by 4.3% to $187.0 billion, reflecting the
strength of private consumption and investment. These developments
lowered the trade surplus by 16.2% to $40.5 billion (Figure 3.26.5). The
deficit in services trade widened sharply, mainly due to a higher deficit
in transportation services and slower growth in tourism, and the income
deficit deteriorated on higher payments of dividends and interest to
foreign companies. Consequently, the current account surplus fell to
$19.4 billion, or 7.9% of GDP, the lowest ratio since 2001.
The capital and financial account recorded net outflows last year.
Inward foreign direct investment totaled $9.4 billion, coming off an
unusually high level in 2011. The balance of payments recorded a small
surplus, and international reserves rose 4.8% to $139.7 billion, cover for
7.3 months of goods and services imports.
Source: Asian Development Outlook
database. ( http://www.adb.org/sites/default/files/ado2013-malaysia.pdf )
Source
http://www.a...aysia.pdf.Category
EconomyGet a Quote
You may also like...