
How the Recession Changed Us
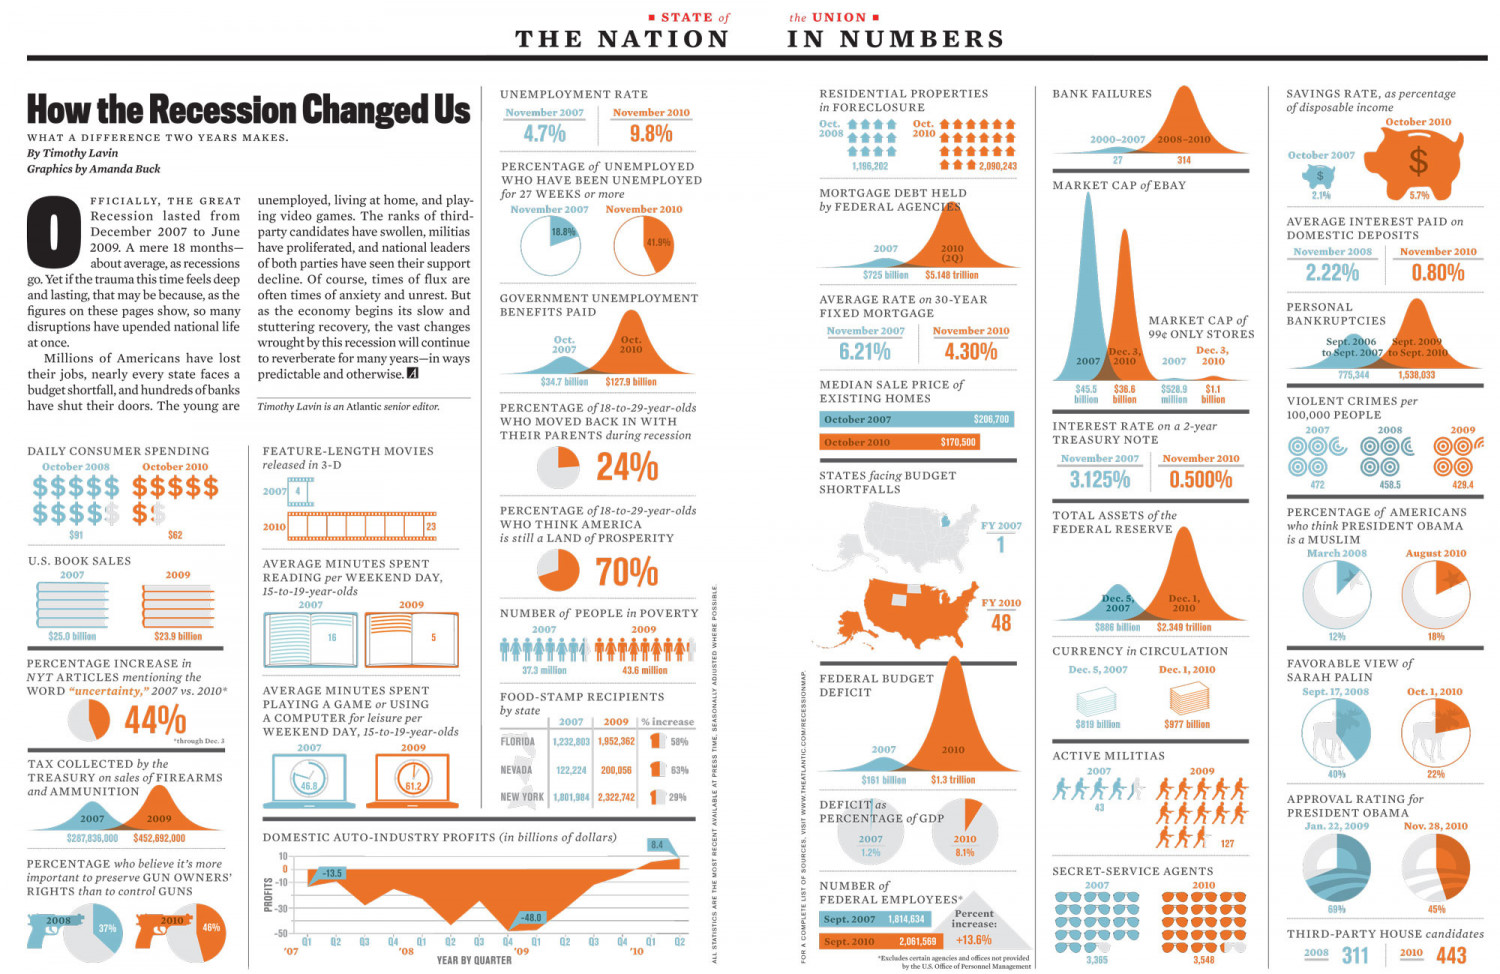
1 STATE of the UNION . THE NATION IN NUMBERS SAVINGS RATE, as percentage of disposable income UNEMPLOYMENT RATE RESIDENTIAL PROPERTIES BANK FAILURES How the Recession Changed Us in FORECLOSURE November 2007 November 2010 October 2010 4.7% 9.8% Oct. 會 會 會合 2008 Oct. 1ttt 2010 WHAT A DIFFERENCE TWO YEARS MAKES. 2000-2007 2008-2010 By Timothy Lavin Graphics by Amanda Buck October 2007 27 314 PERCENTAGE of UNEMPLOYED 1,196.202 1tt 2,090,243 WHO HAVE BEEN UNEMPLOYED MARKET CAP of EBAY for 27 WEEKS or more MORTGAGE DEBT HELD 2.1% 5.7% unemployed, living at home, and play- Recession lasted from ing video games. The ranks of third- party candidates have swollen, militias 2009. A mere 18 months- have proliferated, and national leaders of both parties have seen their support go. Yet if the trauma this time feels deep decline. Of course, times of flux are often times of anxiety and unrest. But as the economy begins its slow and disruptions have upended national life stuttering recovery, the vast changes wrought by this recession will continue to reverberate for many years-in ways FFICIALLY, THE GREAT November 2007 November 2010 by FEDERAL AGENCIES AVERAGE INTEREST PAID on December 2007 to June 18.8% DOMESTIC DEPOSITS 41.9% 2007 2010 November 2008 November 2010 (20) about average, as recessions 2.22% 0.80% $725 billion $5.148 trillion and lasting, that may be because, as the figures on these pages show, so many GOVERNMENT UNEMPLOYMENT AVERAGE RATE on 30-YEAR PERSONAL BENEFITS PAID FIXED MORTGAGE MARKET CAP of BANKRUPTCIES November 2007 November 2010 99¢ ONLY STORES Oct. 2007 Oct. 2010 Sept. 2006 Sept. 2009 to Sept. 2007 to Sept. 2010 at once. 6.21% 4.30% Dec. 3, 2007 2010 Dec. 3, Millions of Americans have lost 2007 2010 1,538,033 their jobs, nearly every state faces a budget shortfall, and hundreds of banks have shut their doors. The young are predictable and otherwise. A 775,344 $34.7 billion $127.9 billion MEDIAN SALE PRICE of EXISTING HOMES $45.5 billion $36.6 billion $520.9 million $1.1 billion VIOLENT CRIMES per Timothy Lavin is an Atlantic senior editor. PERCENTAGE of 18-to-29-year-olds October 2007 $206,700 100,000 PEOPLE WHO MOVED BACK IN WITH INTEREST RATE on a 2-year 2007 2008 2009 THEIR PARENTS during recession TREASURY NOTE October 2010 $170,500 DAILY CONSUMER SPENDING FEATURE-LENGTH MOVIES 24% November 2007 November 2010 October 2008 October 201o released in 3-D STATES facing BUDGET 3.125% 0.500% $$$$$ $$$$$ $$$$ 472 458.5 429.4 2007 4 SHORTFALLS booodor PERCENTAGE of 18-to-29-year-olds PERCENTAGE of AMERICANS who think PRESIDENT OBAMA is a MUSLIM TOTAL ASSETS of the 2010 WHO THINK AMERICA FY 2007 FEDERAL RESERVE $91 $62 is still a LAND of PROSPERITY March 2008 August 2010 70% U.S. BOOK SALES AVERAGE MINUTES SPENT 2007 2009 READING per WEEKEND DAY, 15-to-19-year-olds Dec. 5, 2007 Dec. 1 2010 2007 2009 FY 2010 NUMBER of PEOPLE in POoVERTY 48 $886 billion $2.349 trillion 2007 2009 $25.0 billion $23.9 billion 16 12% 18% CURRENCY in CIRCULATION PERCENTAGE INCREASE in NYT ARTICLES mentioning the WORD "uncertainty," 2007 vs. 2010* 37.3 million Dec. 5, 2007 Dec. 1, 2010 FAVORABLE VIEW of 43.6 million FEDERAL BUDGET SARAH PALIN AVERAGE MINUTES SPENT DEFICIT Sept. 17, 2008 Oct. 1, 2010 FOOD-STAMP RECIPIENTS PLAYING A GAME or USING 44% by state A COMPUTER for leisure per WEEKEND DAY, 15-to-19-year-olds 2007 2009 | % increase $819 billion $977 billion *through Dec. 3 FLORIDA 1,232,803 1,952,362 58% 2007 2009 2007 2010 ACTIVE MILITIAS TAX COLLECTED by the TREASURY on sales of FIREARMS and AMMUNITION NEVADA 122,224 200,056 63% 2007 2009 40% 22% $161 billion $1.3 trillion NEW YORK 1,801,984 2,322,742 29% APPROVAL RATING for DEFICIT as PERCENTAGE of GDP 43 PRESIDENT OBAMA 2007 2009 Jan. 22, 2009 Nov. 28, 201o $287,836,000 $452,692,000 DOMESTIC AUTO-INDUSTRY PROFITS (in billions of dollars) 2007 2010 1.2% 8.1% PERCENTAGE who believe it's more -13.5 SECRET-SERVICE AGENTS important to preserve GUN OWNERS' RIGHTS than to control GUNS NUMBER of 2007 2010 FEDERAL EMPLOYEES* -30 69% 45% Percent 2008 2010 -48.0 Sept. 2007 1,814,634 increase: 37% 46% -50- THIRD-PARTY HOUSE candidates 03 04 01 '10 Q2 04 "08 +13.6% 03 02 04 02 03 01 '09 YEAR BY QUARTER 02 Sept. 2010 2,061,569 2008 311 2010 443 '07 *Excludes certain agencies and offices not provided by the U.S. Office of Personnel Management 3,365 3,548 PROFITS ALL STATISTICS ARE ADJUSTED WHERE POSSIBLE FOR A COMPLETE LIST OF SOURCES, VISIT %24
How the Recession Changed Us

Source
Unknown. Add a sourceCategory
EconomyGet a Quote
You may also like...


