subscribe

Embed the above image on your site

Image width: px

Het Grote Carnavalsonderzoek

0
COMMENTS
1
LIKE
173
VIEWS
Added by stef_vliet
89 days ago
liked by 1 members
Het Grote Carnavalsonderzoek

Embed the above image on your site

Image width: px

Direct Link


Ranked 227 of 311 in Humor

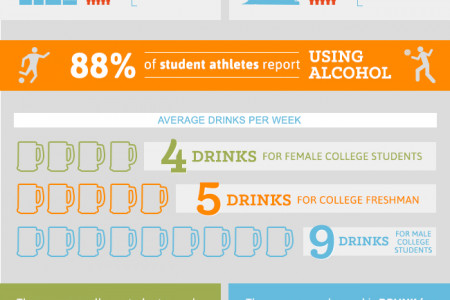
This infographic visualises the most important conclusions from our research among 950 respondents. It answers questions like: how many beer do people drink during Dutch carnival, how much do they cheat and how long are they absent through illness after the carnival.
SIGN IN
REGISTER
  • Explore the best data visualizations on the web
  • Vote, bookmark, and comment
  • Upload and promote your work
  • Create infographics
SIGN UP
Already on Visual.ly?   Sign In

Create your Visual.ly account

Terms of Service
Printable version

By clicking on "Sign Up" below, you are agreeing to the Terms of Service above and the Privacy Policy
Username is not valid
Great!
Already taken, try another
Great!