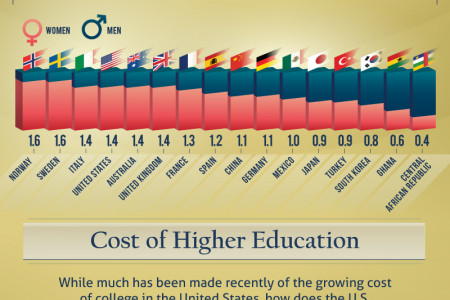
Gender in Higher Higher Ed
VETRINARY MEDICINE PUBLIC ADMINISTRATION & 76.8% 2504 SOCIAL SERVICES 75.1% 33,789 GENDER IN HIGHER HIGHER ED Family & Consumer Science 84.1% 2,522 HEALTH MANAGEMENT AND SERVICES 75.1% 33.789 BLURB 8 MOST Communications, Based on number of graduate degrees awarded by American Institutions in 2008. no phds. Selected majors. PSYCHOLOGY 78.3% 26,727 LIBRARY SCIENCE 79.9% 7.226 Journalism and Related MALE/FEMALE 67.3% 7,404 DOMINATED PREDOMINANTLY WOMEN Total graduate student population, women outnumber men roughly 3 to 2. FIELDS MEN 223,034 (41%) WOMEN 223,034 (59%) Theology & Religious EDUCATION 76.8% 184,371 Vocations ETHNICALLY DIVERSE 65.7% & Religious "ocations 5.7% 193 old 14,193 The disparity between male and female students in the discipline of Education alone can account for the numbers. TRANSP MATERIALS MUVING 84.4% 982 TRANSPORTATION & MATERIALS MOVING 84.4% 982 HYSICAL SCIENCES & TECHNOLOGY 66.4% 10,703 Mathematics & Statistics 59.9% 6,340 01010 01100 CHIROPRACTIC MEDICINE 63.8% 2,639 10101 Engineering & Related Technologies 77.1% PHILOSOPHY & RELIGIOUS STUDIES 66.4% 2,514 COMPUTER 2,759 INFORMATION SCIENCE 73.7 % 18,781 Source: U.S. Dept. of Education IPEDS Survey, 2008. Tables xxx and xxx
Gender in Higher Higher Ed
Source
Unknown. Add a sourceCategory
EducationGet a Quote


