Firearm offences (excluding air weapons) by police force area
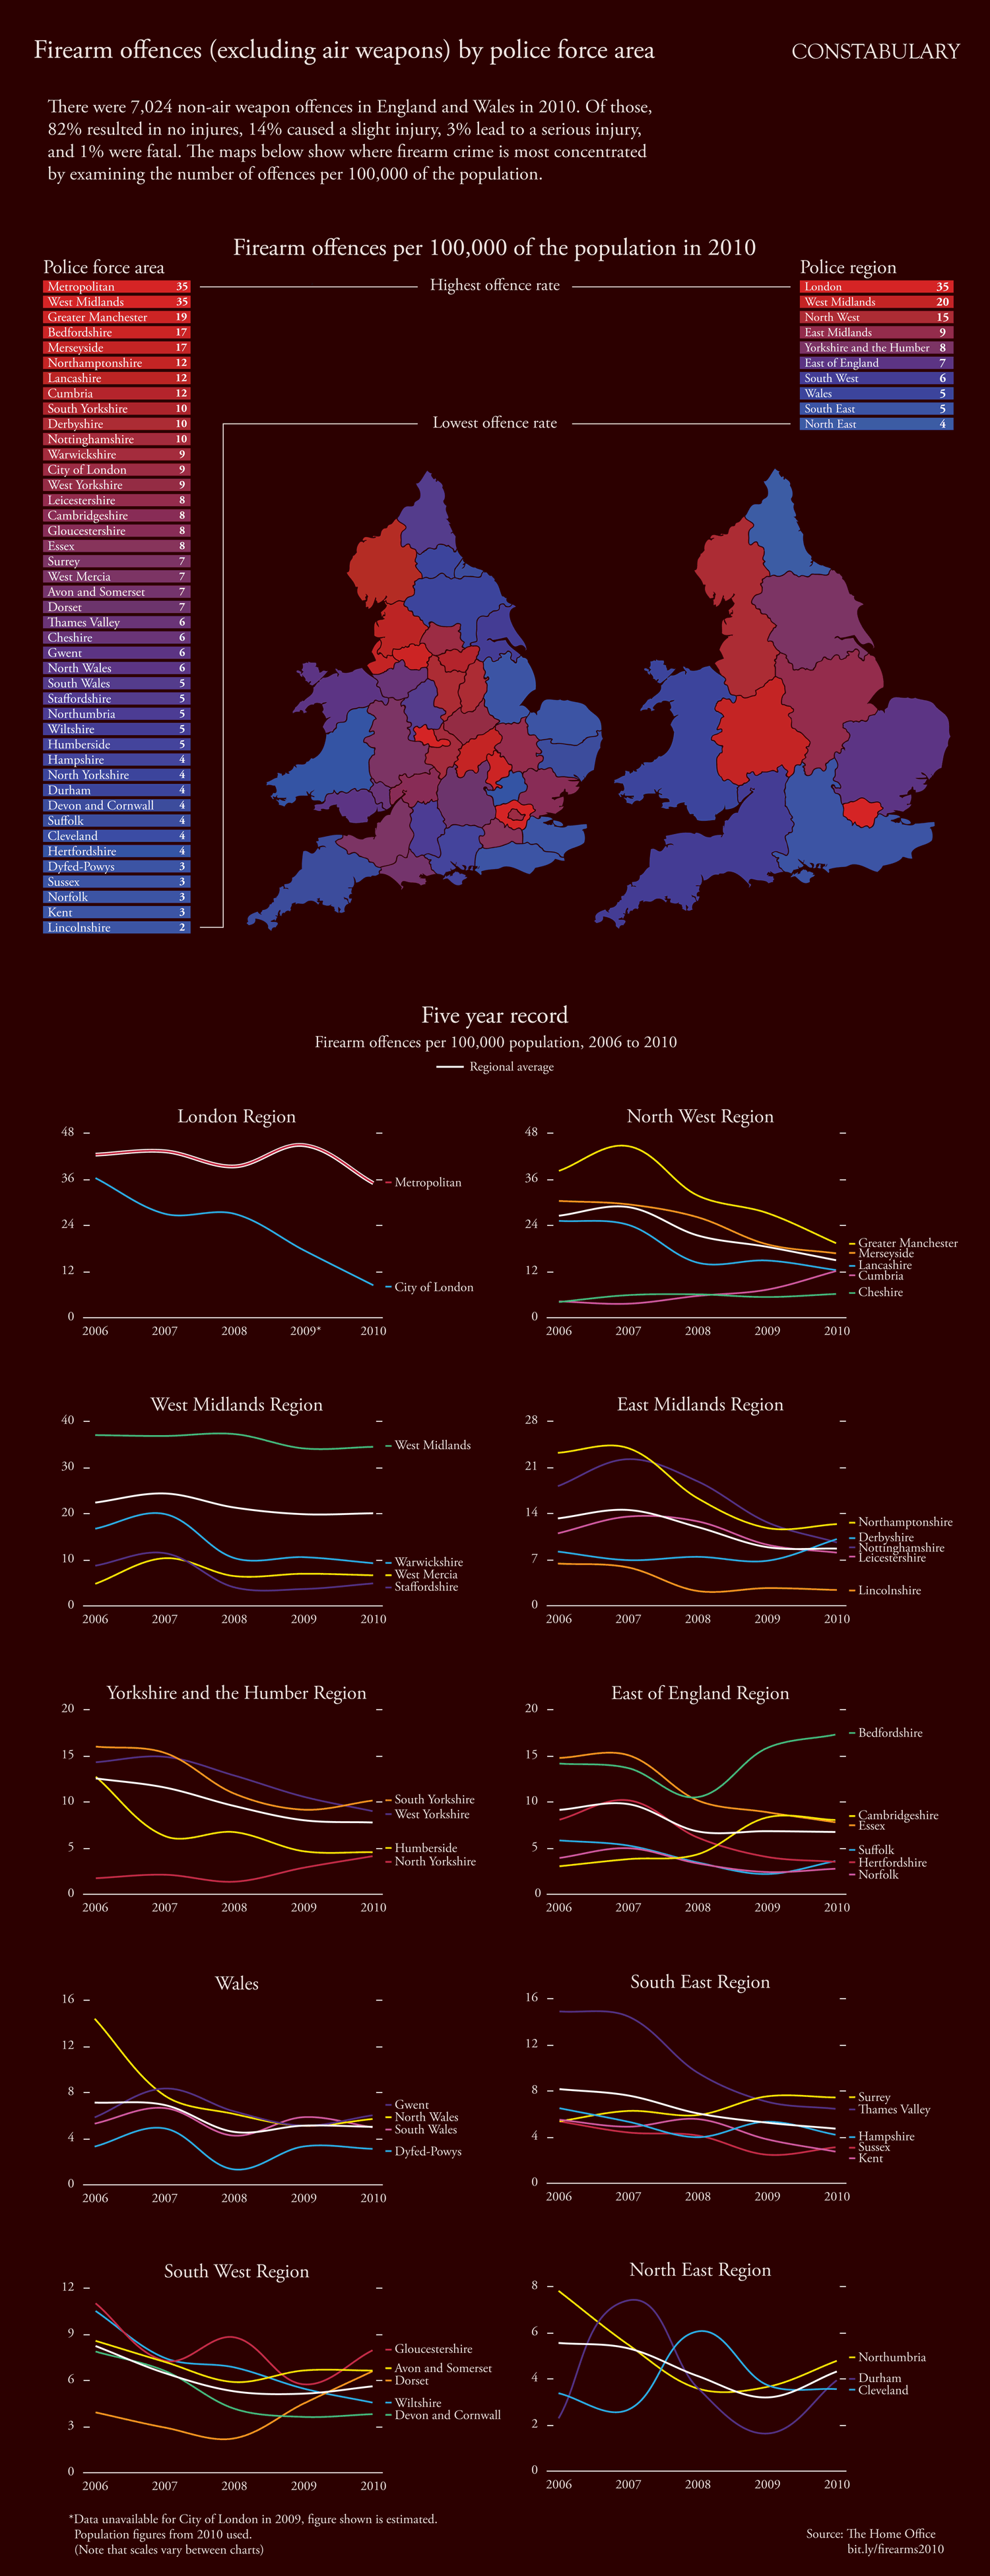
Firearm offences (excluding air weapons) by police force area CONSTABULARY There were 7,024 non-air weapon offences in England and Wales in 2010. Of those, 82% resulted in no injures, 14% caused a slight injury, 3% lead to a serious injury, and 1% were fatal. The maps below show where firearm crime is most concentrated by examining the number of offences per 100,000 of the population. Firearm offences per 100,000 of the population in 2010 Police force area Police region Metropolitan West Midlands Highest offence rate 35 London 35 35 West Midlands 20 Greater Manchester 19 North West 15 Bedfordshire 17 East Midlands Merseyside Northamptonshire Lancashire 17 Yorkshire and the Humber 8 12 East of England 12 South West Cumbria 12 Wales South Yorkshire 10 South East Lowest offence rate Derbyshire Nottinghamshire Warwickshire 10 North East 10 |City of London West Yorkshire Leicestershire |Cambridgeshire Gloucestershire Essex 8 |Surrey West Mercia Avon and Somerset Dorset Thames Valley Cheshire 6. Gwent North Wales South Wales Staffordshire 5 Northumbria 5 Wiltshire Humberside Hampshire North Yorkshire 4 4 Durham Devon and Cornwall Suffolk Cleveland Hertfordshire Dyfed-Powys Sussex Norfolk 3 Kent 3 Lincolnshire 2 Five year record Firearm offences per 100,000 population, 2006 to 2010 Regional average London Region North West Region 48 - 48 - 36 -- Metropolitan 36 - 24 - 24 - - Greater Manchester Merseyside - Lancashire Cumbria 12 - 12 - - City of London - Cheshire 2006 2007 2008 2009* 2010 2006 2007 2008 2009 2010 West Midlands Region East Midlands Region 40 - 28 - West Midlands 30 - 21 - 20 14 - - Northamptonshire Derbyshire Nottinghamshire 10 - Leicestershire -- Warwickshire - West Mercia - Staffordshire - Lincolnshire 2006 2007 2008 2009 2010 2006 2007 2008 2009 2010 Yorkshire and the Humber Region East of England Region 20 - 20 - - Bedfordshire 15 - 15 - -- South Yorkshire West Yorkshire 10 - 10 - - Cambridgeshire -- Humberside - North Yorkshire -- Suffolk Hertfordshire - Norfolk 2006 2007 2008 2009 2010 2006 2007 2008 2009 2010 Wales South East Region 16 - 16 - 12 - 12 - - Surrey Thames Valley Gwent - North Wales - South Wales 4 - Hampshire Sussex 4 - Dyfed-Powys Kent 2006 2007 2008 2009 2010 2006 2007 2008 2009 2010 South West Region North East Region 12 - - Gloucestershire - Northumbria - Avon and Somerset -- Dorset 4 - Durham - Cleveland - Wiltshire - Devon and Cornwall 3 - 2 - 2006 2007 2008 2009 2010 2006 2007 2008 2009 2010 *Data unavailable for City of London in 2009, figure shown is estimated. Population figures from 2010 used. (Note that scales vary between charts) Source: The Home Office bit.ly/firearms2010
Firearm offences (excluding air weapons) by police force area
Source
http://www.c...ation.htmlCategory
OtherGet a Quote

