
The Financial State of the American Household
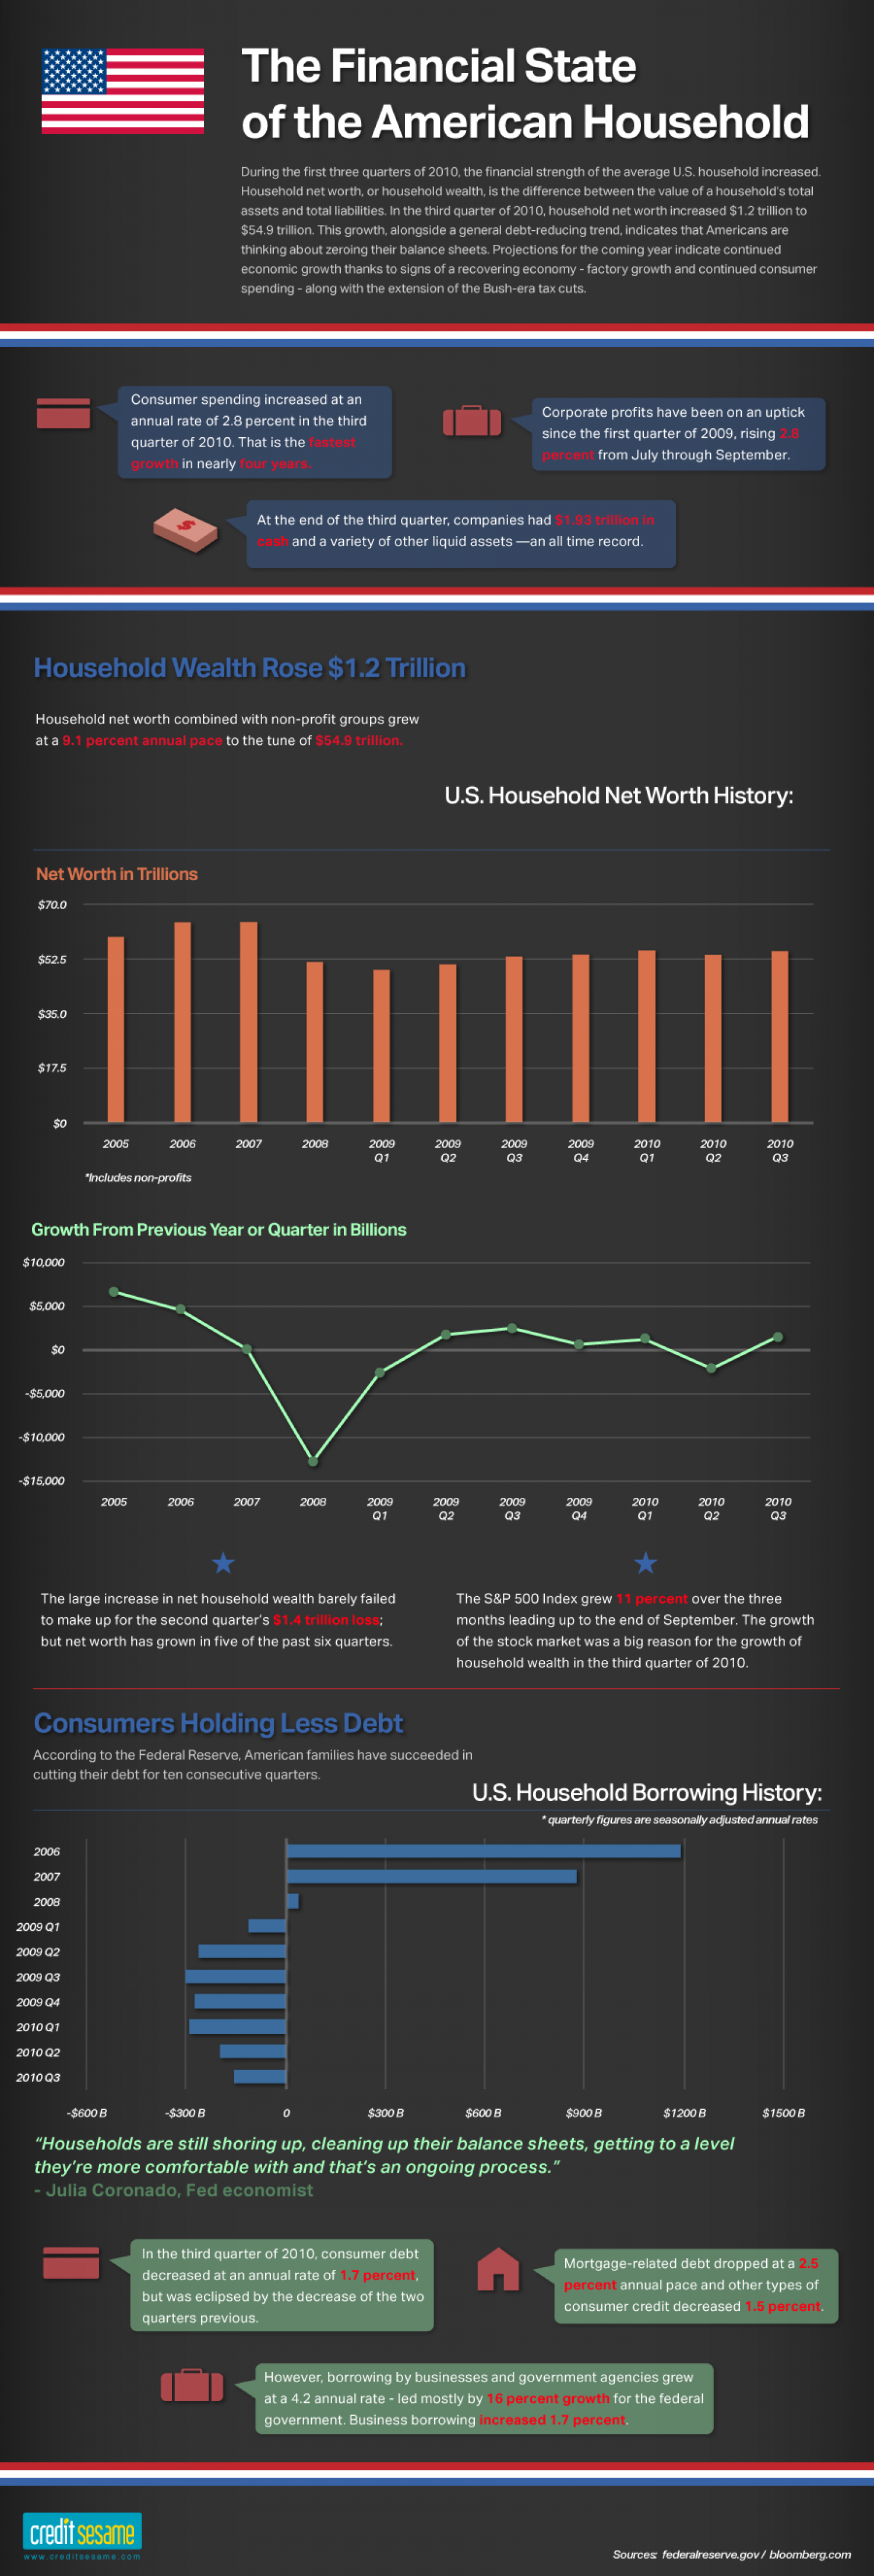
The Financial State of the American Household During the first three quarters of 2010, the financial strength of the average U.S. household increased. Household net worth, or household wealth, is the difference between the value of a household's total assets and total liabilities. In the third quarter of 2010, household net worth increased $1.2 trillion to $54.9 trillion. This growth, alongside a general debt-reducing trend, indicates that Americans are thinking about zeroing their balance sheets. Projections for the coming year indicate continued economic growth thanks to signs of a recovering economy - factory growth and continued consumer spending - along with the extension of the Bush-era tax cuts. Consumer spending increased at an Corporate profits have been on an uptick annual rate of 2.8 percent in the third since the first quarter of 2009, rising quarter of 2010. That is the fastest percent from July through September. growth in nearly four years. At the end of the third quarter, companies had $1.93 trillion in cash and a variety of other liquid assets –an all time record. Household Wealth Rose $1.2 Trillion Household net worth combined with non-profit groups grew at a 9.1 percent annual pace to the tune of $54.9 trillion. U.S. Household Net Worth History: Net Worth in Trillions $70.0 $52.5 $35.0 $17.5 $0 2005 2006 2007 2008 2009 2009 2009 2009 2010 2010 2010 Q1 Q2 Q3 Q4 Q1 Q2 Q3 *Includes non-profits Growth From Previous Year or Quarter in Billions $10,000 $5,000 $0 -$5,000 -$10.000 -$15,000 2005 2006 2007 2008 2009 2009 2009 2009 2010 2010 2010 Q1 Q2 Q3 Q4 Q1 Q2 Q3 The large increase in net household wealth barely failed The S&P 500 Index grew 11 percent over the three to make up for the second quarter's $1.4 trillion loss; but net worth has grown in five of the past six quarters. months leading up to the end of September. The growth of the stock market was a big reason for the growth of household wealth in the third quarter of 2010. Consumers Holding Less Debt According to the Federal Reserve, American families have succeeded in cutting their debt for ten consecutive quarters. U.S. Household Borrowing History: * quarterly figures are seasonally adjusted annual rates 2006 2007 2008 2009 Q1 2009 Q2 2009 Q3 2009 Q4 2010 Q1 2010 Q2 2010 Q3 -$600 B -$300 B $300 B $600 B $900 B $1200 B $1500 B "Households are still shoring up, cleaning up their balance sheets, getting to a level they're more comfortable with and that's an ongoing process." - Julia Coronado, Fed economist In the third quarter of 2010, consumer debt decreased at an annual rate of 1.7 percent, Mortgage-related debt dropped at a 2.5 percent annual pace and other types of consumer credit decreased 1.5 percent. but was eclipsed by the decrease of the two quarters previous. However, borrowing by businesses and government agencies grew at a 4.2 annual rate - led mostly by 16 percent growth for the federal government. Business borrowing increased 1.7 percent. credit sesame Sources federalreserve.gov/ bloomberg.com www.creditsesame.com
The Financial State of the American Household

Source
http://www.c...household/Category
EconomyGet a Quote
You may also like...


