Exxon Earnings Review
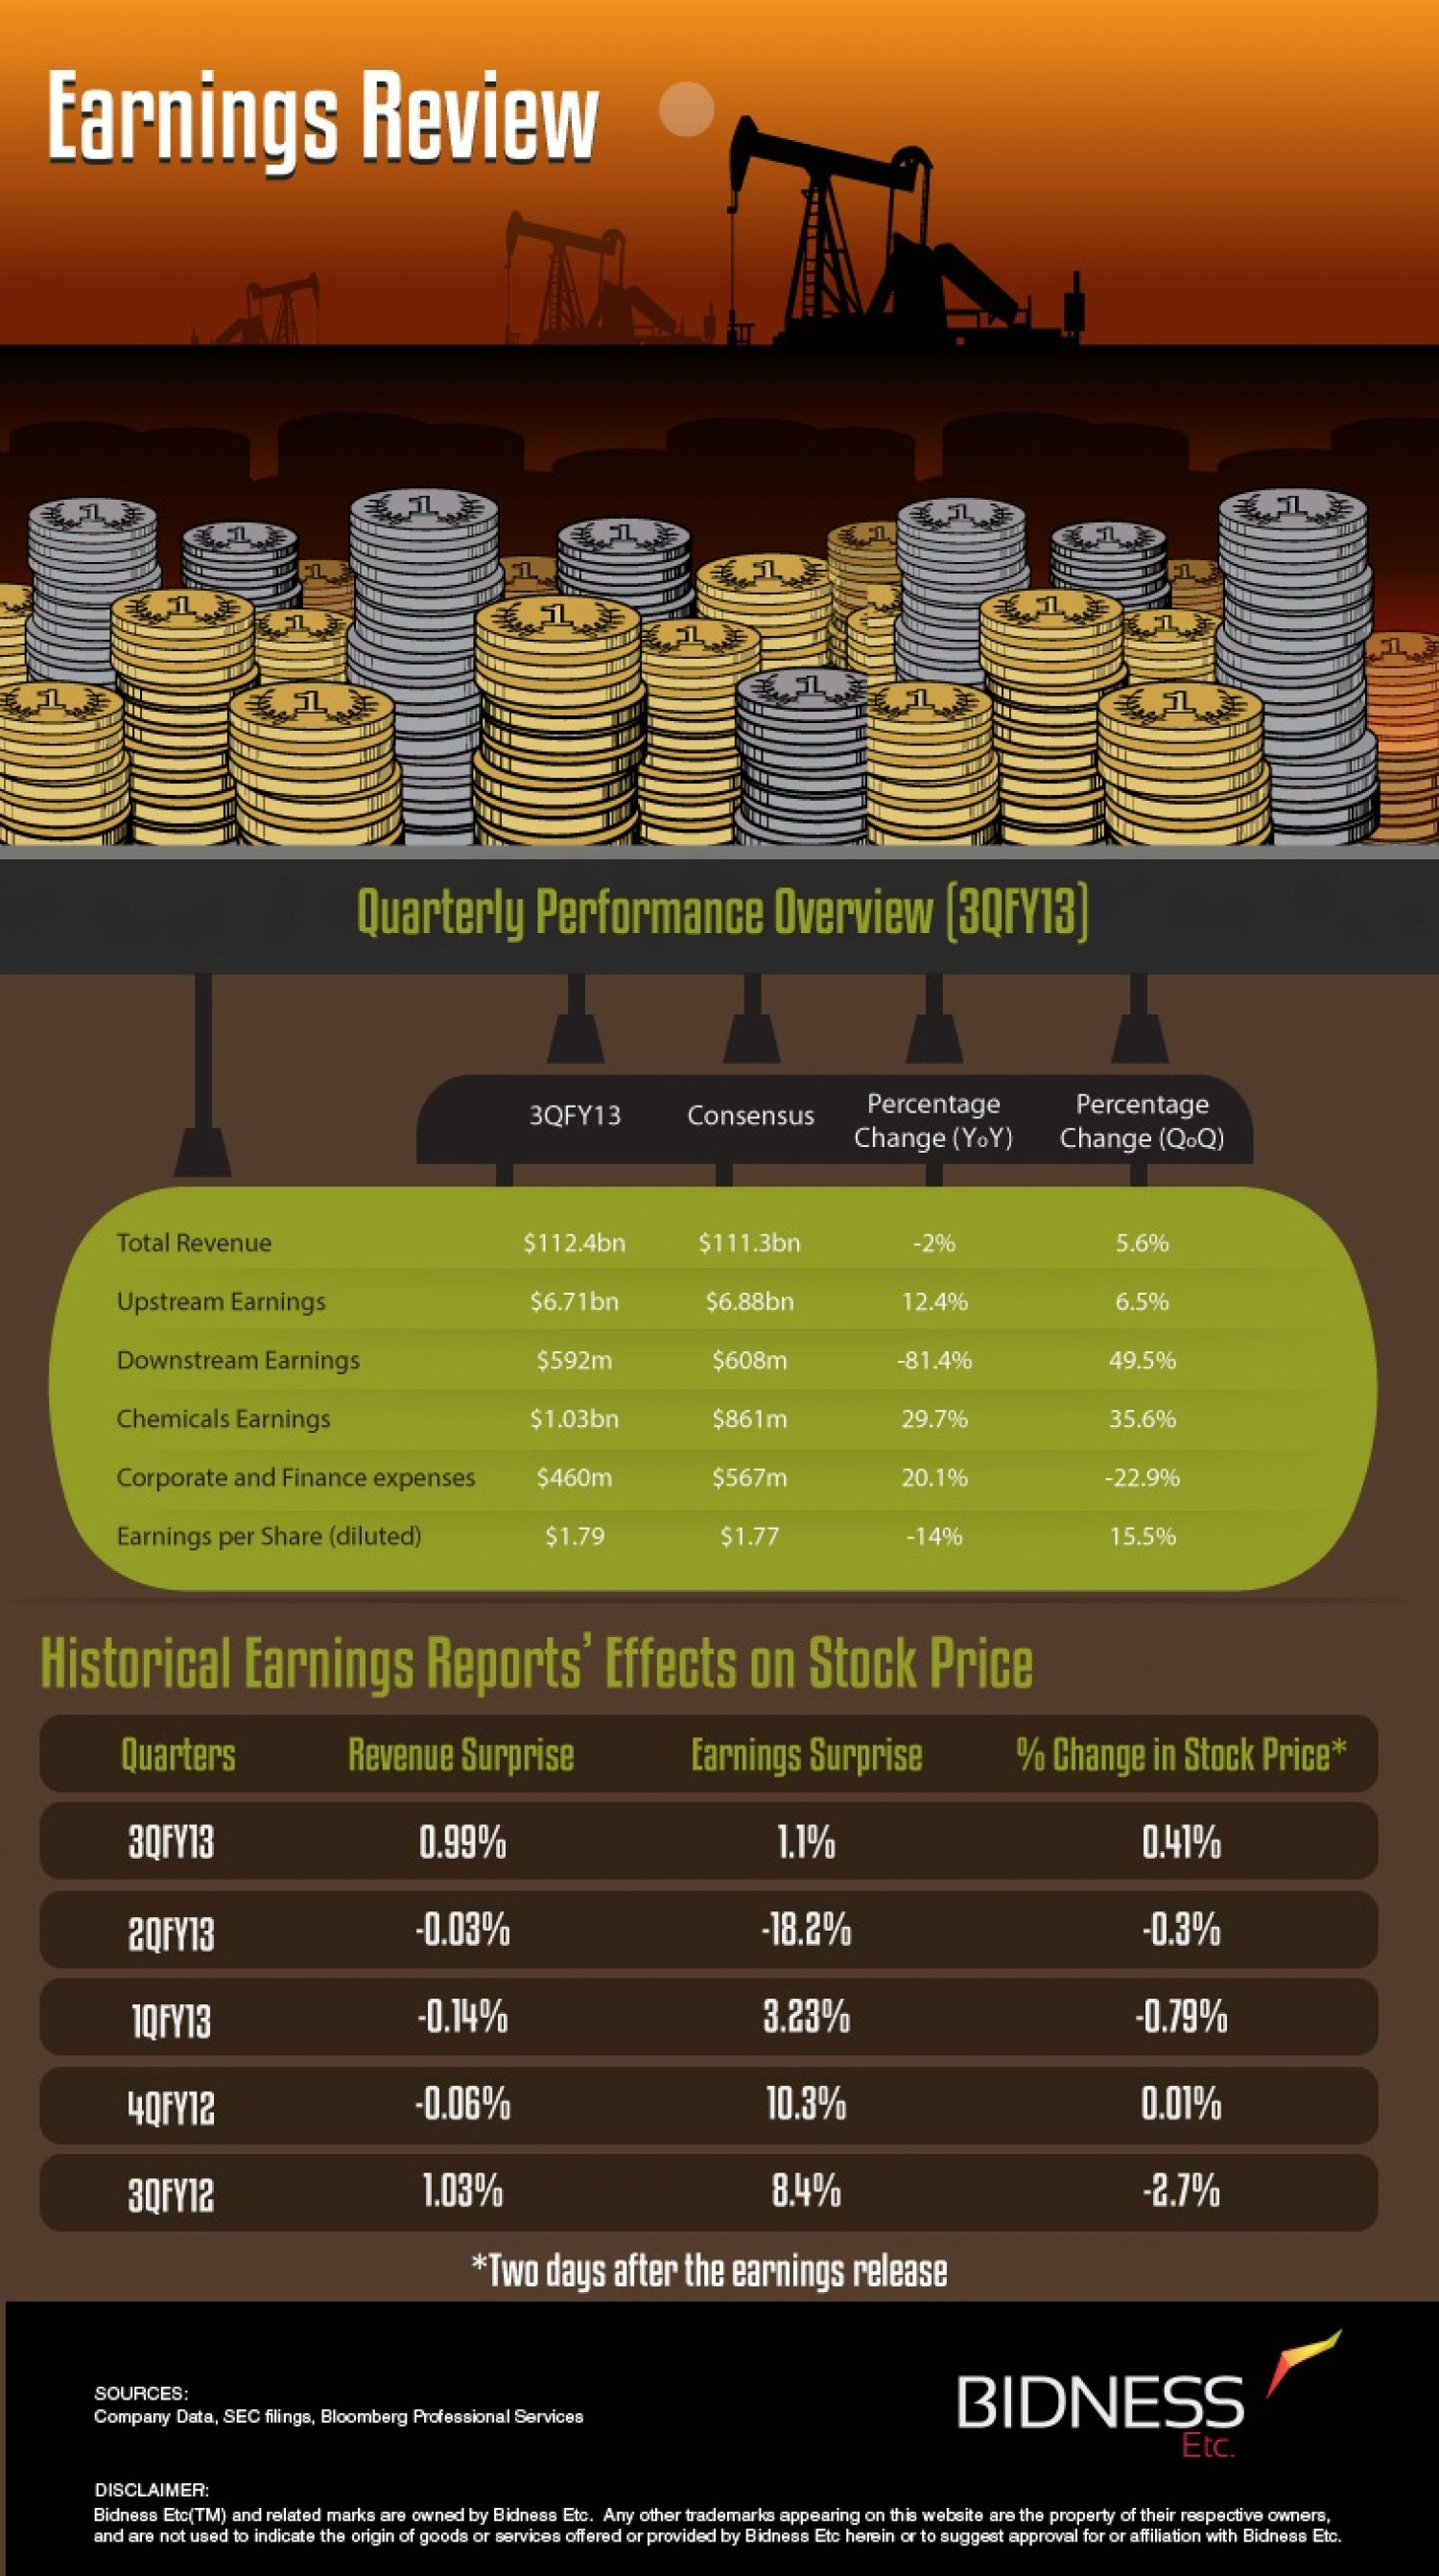
Earnings Review Quarterly Performance Overview (3QFY13) Percentage Change (YoY) Percentage 3QFY13 Consensus Change (QoQ) Total Revenue $112.4bn $111.3bn -2% 5.6% Upstream Earnings $6.71bn $6.88bn 12.4% 6.5% Downstream Earnings $592m $608m -81.4% 49.5% Chemicals Earnings $1.03bn $861m 29.7% 35.6% Corporate and Finance expenses $460m $567m 20.1% -22.9% Earnings per Share (diluted) $1.79 $1.77 -14% 15.5% Historical Earnings Reports' Effects on Stock Price Quarters Revenue Surprise Earnings Surprise % Change in Stock Price* 30FY13 0.99% 1.1% 0.41% 20FY13 -0.03% -18.2% -0.3% 1QFY13 -0.14% 3.23% -0.79% 40FY12 -0.06% 10.3% 0.01% 30FY12 1.03% 8.4% -2.7% *Two days after the earnings release BIDNESS SOURCES: Company Data, SEC filings, Bloomberg Professional Services Etc. DISCLAIMER: Bidness Etc(TM) and related marks are owned by Bidness Etc. Any other trademarks appearing on this website are the property of their respective owners, and are not used to indicate the origin of goods or services offered or provided by Bidness Etc herein or to suggest approval for or affiliation with Bidness Etc.
Exxon Earnings Review
Source
http://www.b...ngs-reviewCategory
BusinessGet a Quote