
Brighter travel hot-spots at a glance 1995-2020
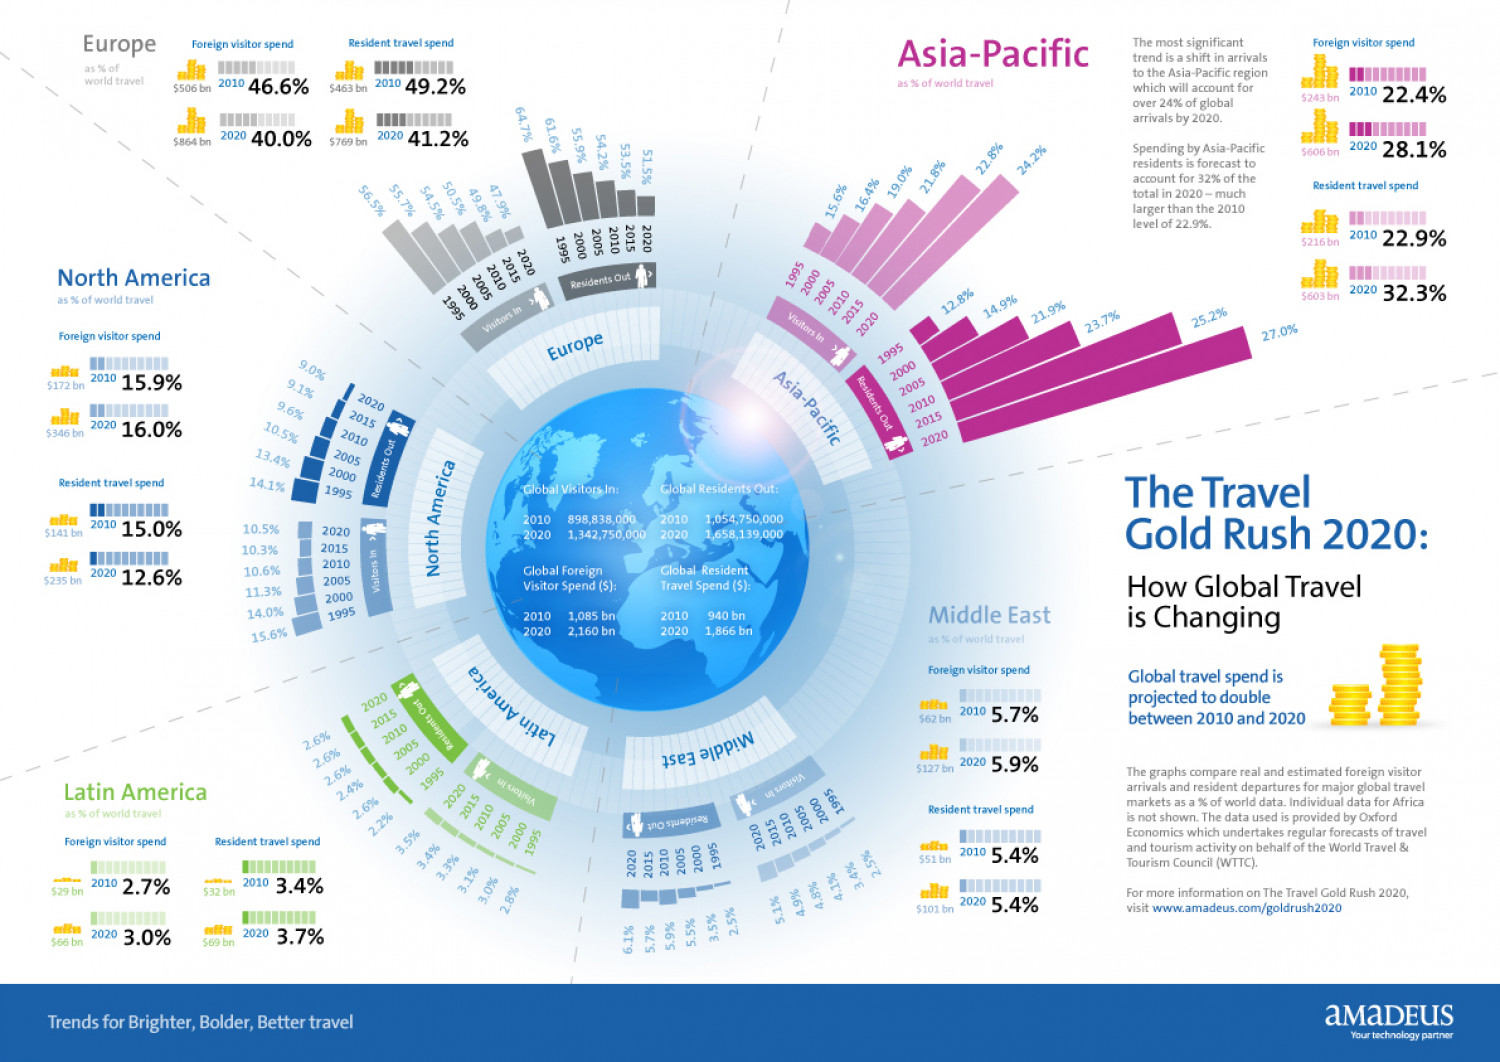
Europe Foreign visitor spend Resident travel spend Asia-Pacific as % of The most significant world travel Foreign visitor spend $506 bn 2010 46.6% $463 bn 2010 49.2% trend is a shift in arrivals to the Asia-Pacific region which will account for as % of world travel $243 bn 2010 22.4% $864 bn 2020 40.0% $769 bn 2020 41.2% over 24% of global arrivals by 2020. Spending by Asia-Pacific residents is forecast to S606 bn 2020 28.1% 24.2% account for 32% of the total in 2020- much Resident travel spend larger than the 2010 level of 22.9%. North America 2010 22.9% $216 bn as % of world travel Residents Out> Visitors in S603 bn 2020 32.3% Foreign visitor spend 12.8% Visitors in 14.9% 21.9% 23.7% 25.2% Europe ulle $172 bn 2010 15.9% 9.0% 27.0% 9.1% 2020 lla I $346 bn 9.6% | 2015 2020 '16.0% 10.5% 2010 13.4% 2005 Resident travel spend 14.1% 2000 1995 Global Visitors In: Clobal Residents Out: The Travel Gold Rush 2020: lls 2010 15.0% $141 bn 10.5% 2020 2010 2010 1,054,750,000 898,838,000 2020 1,342,750,000 2020 1,658,139,000 10.3% 2015 2010 $235 bn 2020 12.6% 10.6% Global Foreign Visitor Spend (S): 2005 Global Resident 11.3% 14.0% 2000 1995 Travel Spend ($): How Global Travel 1,085 bn 2,160 bn 2010 2010 940 bn Middle East is Changing 15.6% 2020 2020 1,866 bn as % of world travel Foreign visitor spend Global travel spend is projected to double between 2010 and 2020 2020 $62 bn 2010 5.7% 2.6% Latin America teller $127 bn 2020 5.9% 2.6% Middle East Latin America 2.6% 2.4% 2.6% The graphs compare real and estimated foreign visitor arrivals and resident departures for major global travel markets as a % of world data. Individual data for Africa Visitors In as % of world travel Visitors In Resident travel spend Foreign visitor spend 2.2% Resident travel spend Residents Out is not shown. The data used is provided by Oxford Economics which undertakes regular forecasts of travel and tourism activity on behalf of the World Travel & Tourism Council (WTTC). - 2010 2.7% 2010 3.4% $32 bn $51 bn 2010 5.4% $29 bn ll 2020 3.0% $66 bn f 2020 3.7% $69 bn ll 2020 5.4% For more information on The Travel Gold Rush 2020, visit www.amadeus.com/goldrush2020 $101 bn Trends for Brighter, Bolder, Better travel амaDEUS Your technology partner 22,8% 21.8% %0'61 %9'St 16.4% Residents Out Asia-Pacific 1.8% 50.5% 54.5% 55.7% 56.5% S661 0007 North America Residents Out
Brighter travel hot-spots at a glance 1995-2020
Source
Unknown. Add a sourceCategory
TravelGet a Quote
You may also like...


