
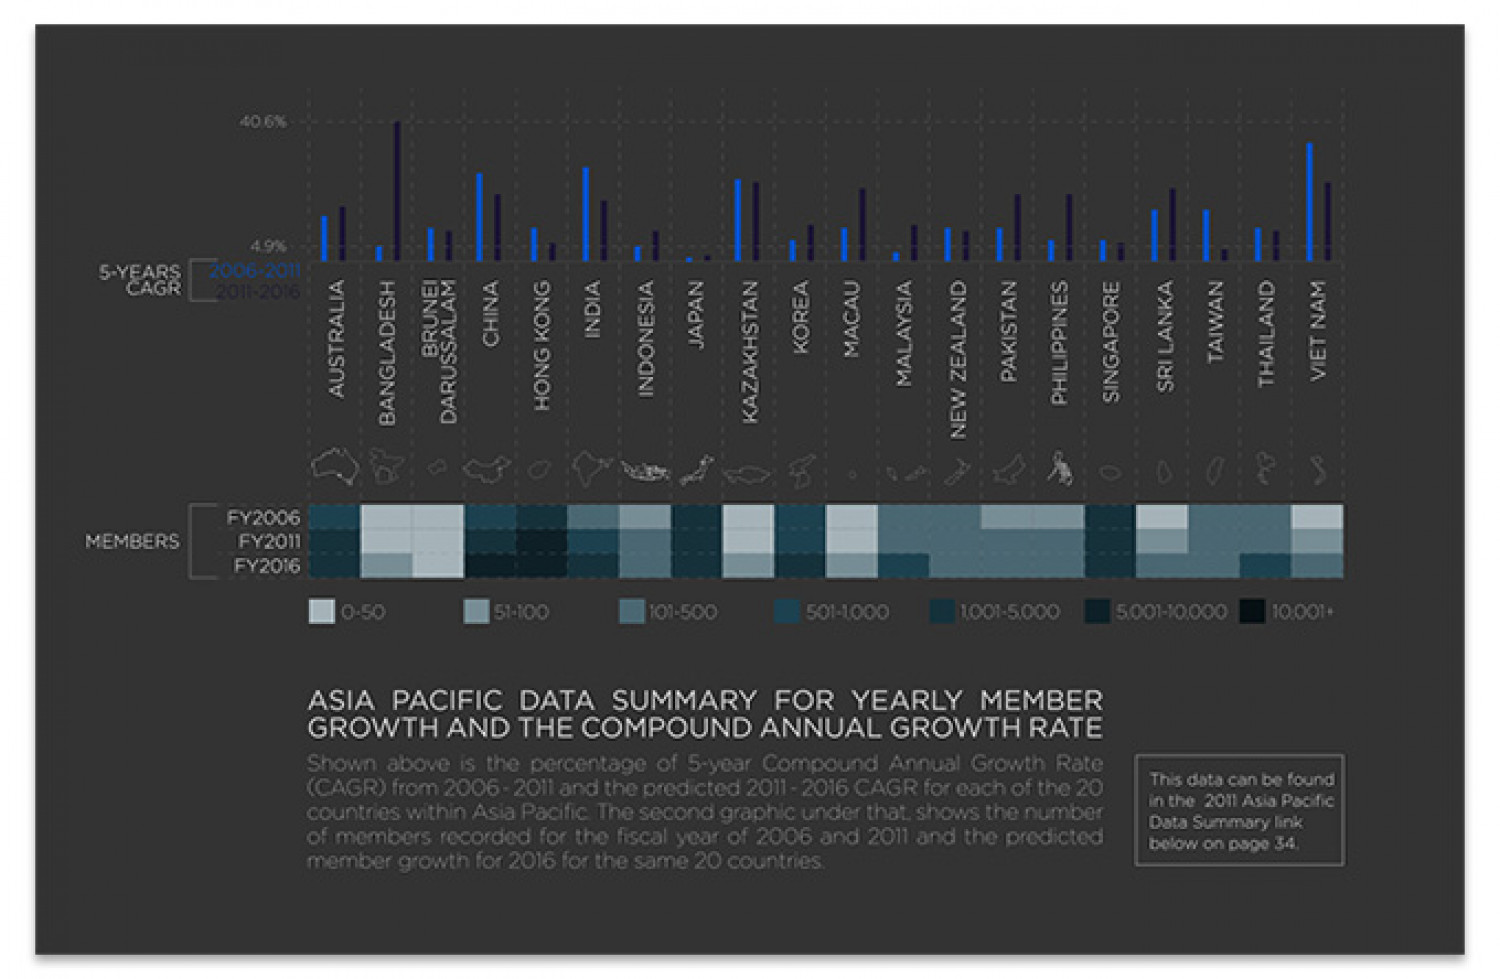
Asia Pacific data summary for yearly member growth and the compound annual growth rate
40 6% 49% 5-YEARS CAGR 2006-2011 2011-2016 300 FY2006 MEMBERS FY2011 FY2016 0-50 51-100 101-500 S01-1000 1001-5.000 5.001-10.000 10.001 ASIA PACIFIC DATA SUMMARY FOR YEARLY MEMBER GROWTH AND THE COMPOUND ANNUAL GROWTH RATE Shown above is the percentage of 5-year Compound Annual Growth Rate (CAGR) from 2006- 2011 and the predicted 2011 - 2016 CAGR for each of the 20 countries within Asia Pacific The second graphic under that, shows the number of members recorded for the fiscal year of 2006 and 2011 and the predicted member growth for 2016 for the same 20 countries This data can be found in the 2011 Asia Pacific Data Summary link below on page 34. AUSTRALIA BANGLADESH BRUNEI DARUSSALAM CHINA HỌNG KONG INDIA INDONESIA JAPAN KAZAKHSTAN KOREA MACAU MALAYSIA NEW ZEALAND PAKISTAN PHILIPPINES SINGAPORE SRI LANKA TAIWAN THAILAND VIET NAM
Asia Pacific data summary for yearly member growth and the compound annual growth rate
Source
http://rhian...rowth.htmlCategory
EconomyGet a Quote
You may also like...


