
AAPL earnings infographic
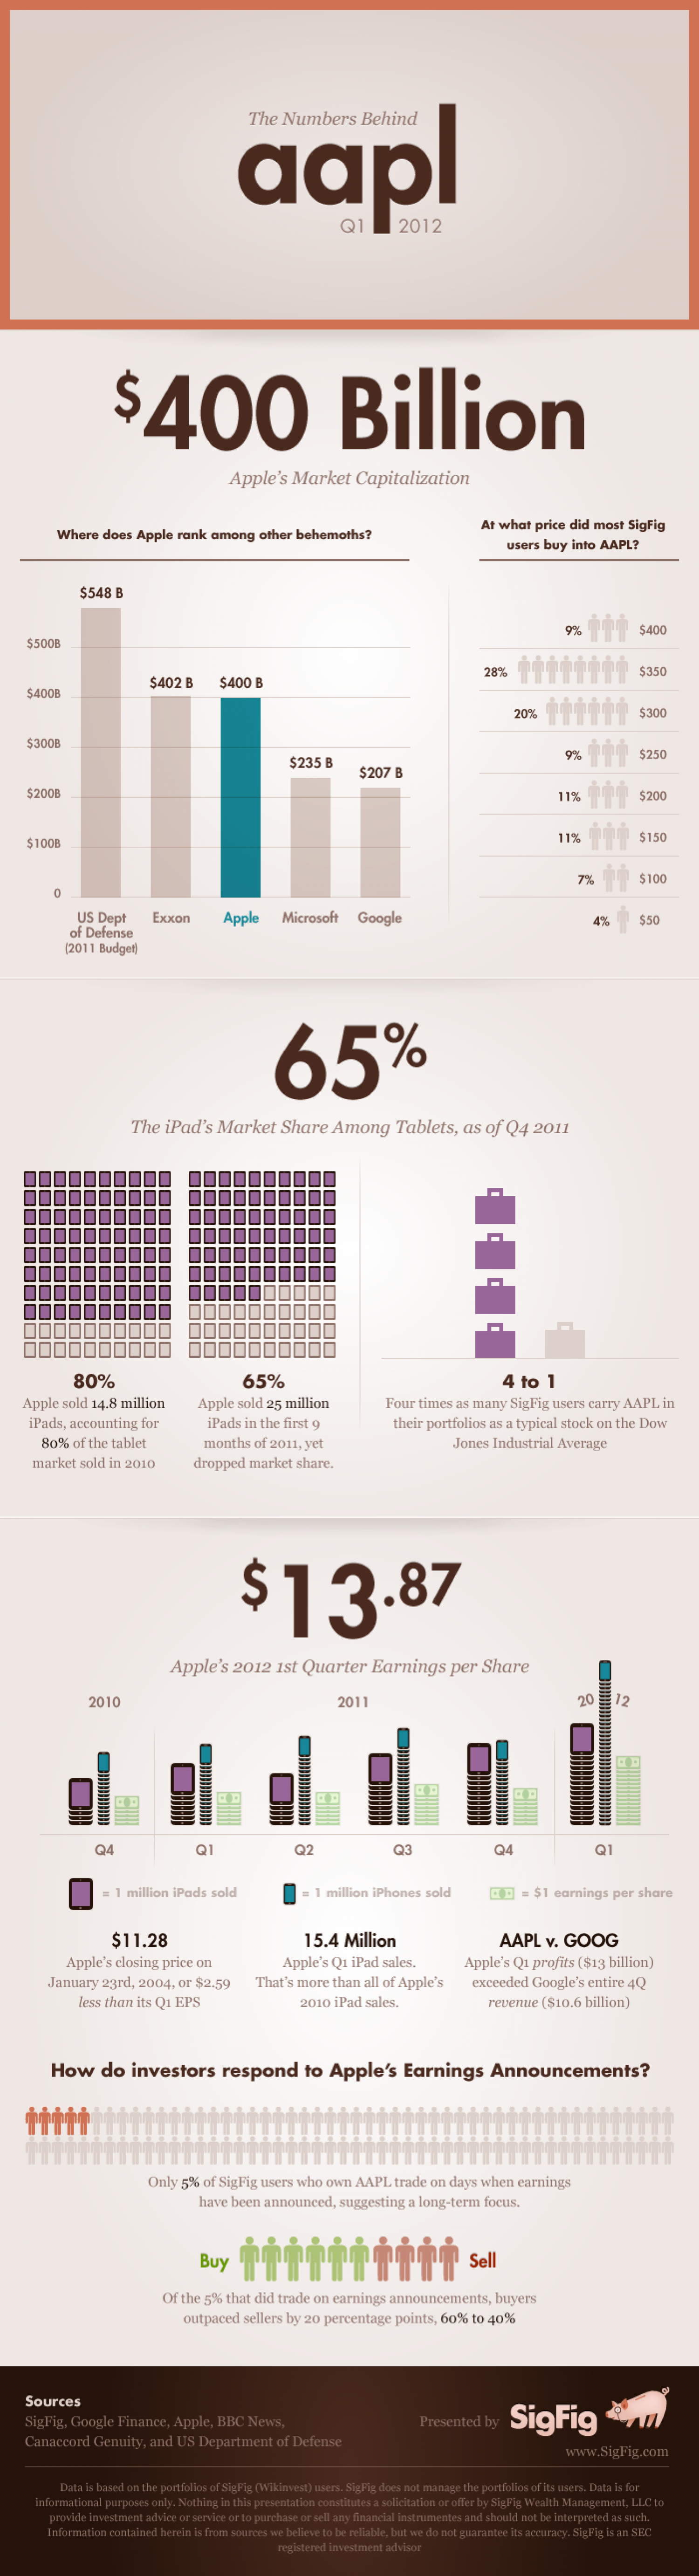
aapl The Numbers Behind Q1 2012 $400 Billion Apple's Market Capitalization At what price did most SigFig Where does Apple rank among other behemoths? users buy into AAPL? $548 B 9% $400 $500B 28% $350 $402 B $400 B $400B 20% $300 $300B 9% $250 $235 B $207 B $200B 11% $200 11% $150 $100B 7% $100 US Dept of Defense (2011 Budget) Exxon Apple Microsoft Google $50 4% 65% The iPad's Market Share Among Tablets, as of Q4 2011 80% 65% 4 to 1 Apple sold 14.8 million iPads, accounting for Apple sold 25 million iPads in the first 9 Four times as many SigFig users carry AAPL in their portfolios as a typical stock on the Dow Jones Industrial Average 80% of the tablet months of 2011, yet market sold in 2010 dropped market share. $13.87 Apple's 2012 1st Quarter Earnings per Share 2010 2011 20 E12 Q4 Q1 Q2 Q3 Q4 Q1 = 1 million iPads sold =1 million iPhones sold C) = $1 earnings per share $11.28 15.4 Million AAPL v. GOOG Apple's closing price on January 23rd, 2004, or $2.59 less than its Qi EPS Apple's Q1 iPad sales. That's more than all of Apple's Apple's Q1 profits ($13 billion) exceeded Google's entire 4Q 2010 iPad sales. revenue ($10.6 billion) How do investors respond to Apple's Earnings Announcements? Only 5% of SigFig users who own AAPL trade on days when earnings have been announced, suggesting a long-term focus. Buy Sell Of the 5% that did trade on earnings announcements, buyers outpaced sellers by 20 percentage points, 60% to 40% Sources SigFig SigFig, Google Finance, Apple, BBC News, Presented by Canaccord Genuity, and US Department of Defense www.SigFig.com Data is based on the portfolios of SigFig (Wikinvest) users. SigFig does not manage the portfolios of its users. Data is for informational purposes only. Nothing in this presentation constitutes a solicitation or offer by SigFig Wealth Management, LLC to provide investment advice or service or to purchase or sell any financial instru Information contained herein is from sources we believe to be reliable, but we do not guarantee its accuracy. SigFig is an SEC s and should not be interpreted as such. registered investment advisor aapl The Numbers Behind Q1 2012 $400 Billion Apple's Market Capitalization At what price did most SigFig Where does Apple rank among other behemoths? users buy into AAPL? $548 B 9% $400 $500B 28% $350 $402 B $400 B $400B 20% $300 $300B 9% $250 $235 B $207 B $200B 11% $200 11% $150 $100B 7% $100 US Dept of Defense (2011 Budget) Exxon Apple Microsoft Google $50 4% 65% The iPad's Market Share Among Tablets, as of Q4 2011 80% 65% 4 to 1 Apple sold 14.8 million iPads, accounting for Apple sold 25 million iPads in the first 9 Four times as many SigFig users carry AAPL in their portfolios as a typical stock on the Dow Jones Industrial Average 80% of the tablet months of 2011, yet market sold in 2010 dropped market share. $13.87 Apple's 2012 1st Quarter Earnings per Share 2010 2011 20 E12 Q4 Q1 Q2 Q3 Q4 Q1 = 1 million iPads sold =1 million iPhones sold C) = $1 earnings per share $11.28 15.4 Million AAPL v. GOOG Apple's closing price on January 23rd, 2004, or $2.59 less than its Qi EPS Apple's Q1 iPad sales. That's more than all of Apple's Apple's Q1 profits ($13 billion) exceeded Google's entire 4Q 2010 iPad sales. revenue ($10.6 billion) How do investors respond to Apple's Earnings Announcements? Only 5% of SigFig users who own AAPL trade on days when earnings have been announced, suggesting a long-term focus. Buy Sell Of the 5% that did trade on earnings announcements, buyers outpaced sellers by 20 percentage points, 60% to 40% Sources SigFig SigFig, Google Finance, Apple, BBC News, Presented by Canaccord Genuity, and US Department of Defense www.SigFig.com Data is based on the portfolios of SigFig (Wikinvest) users. SigFig does not manage the portfolios of its users. Data is for informational purposes only. Nothing in this presentation constitutes a solicitation or offer by SigFig Wealth Management, LLC to provide investment advice or service or to purchase or sell any financial instru Information contained herein is from sources we believe to be reliable, but we do not guarantee its accuracy. SigFig is an SEC s and should not be interpreted as such. registered investment advisor
AAPL earnings infographic
Source
Unknown. Add a sourceCategory
BusinessGet a Quote
You may also like...


