
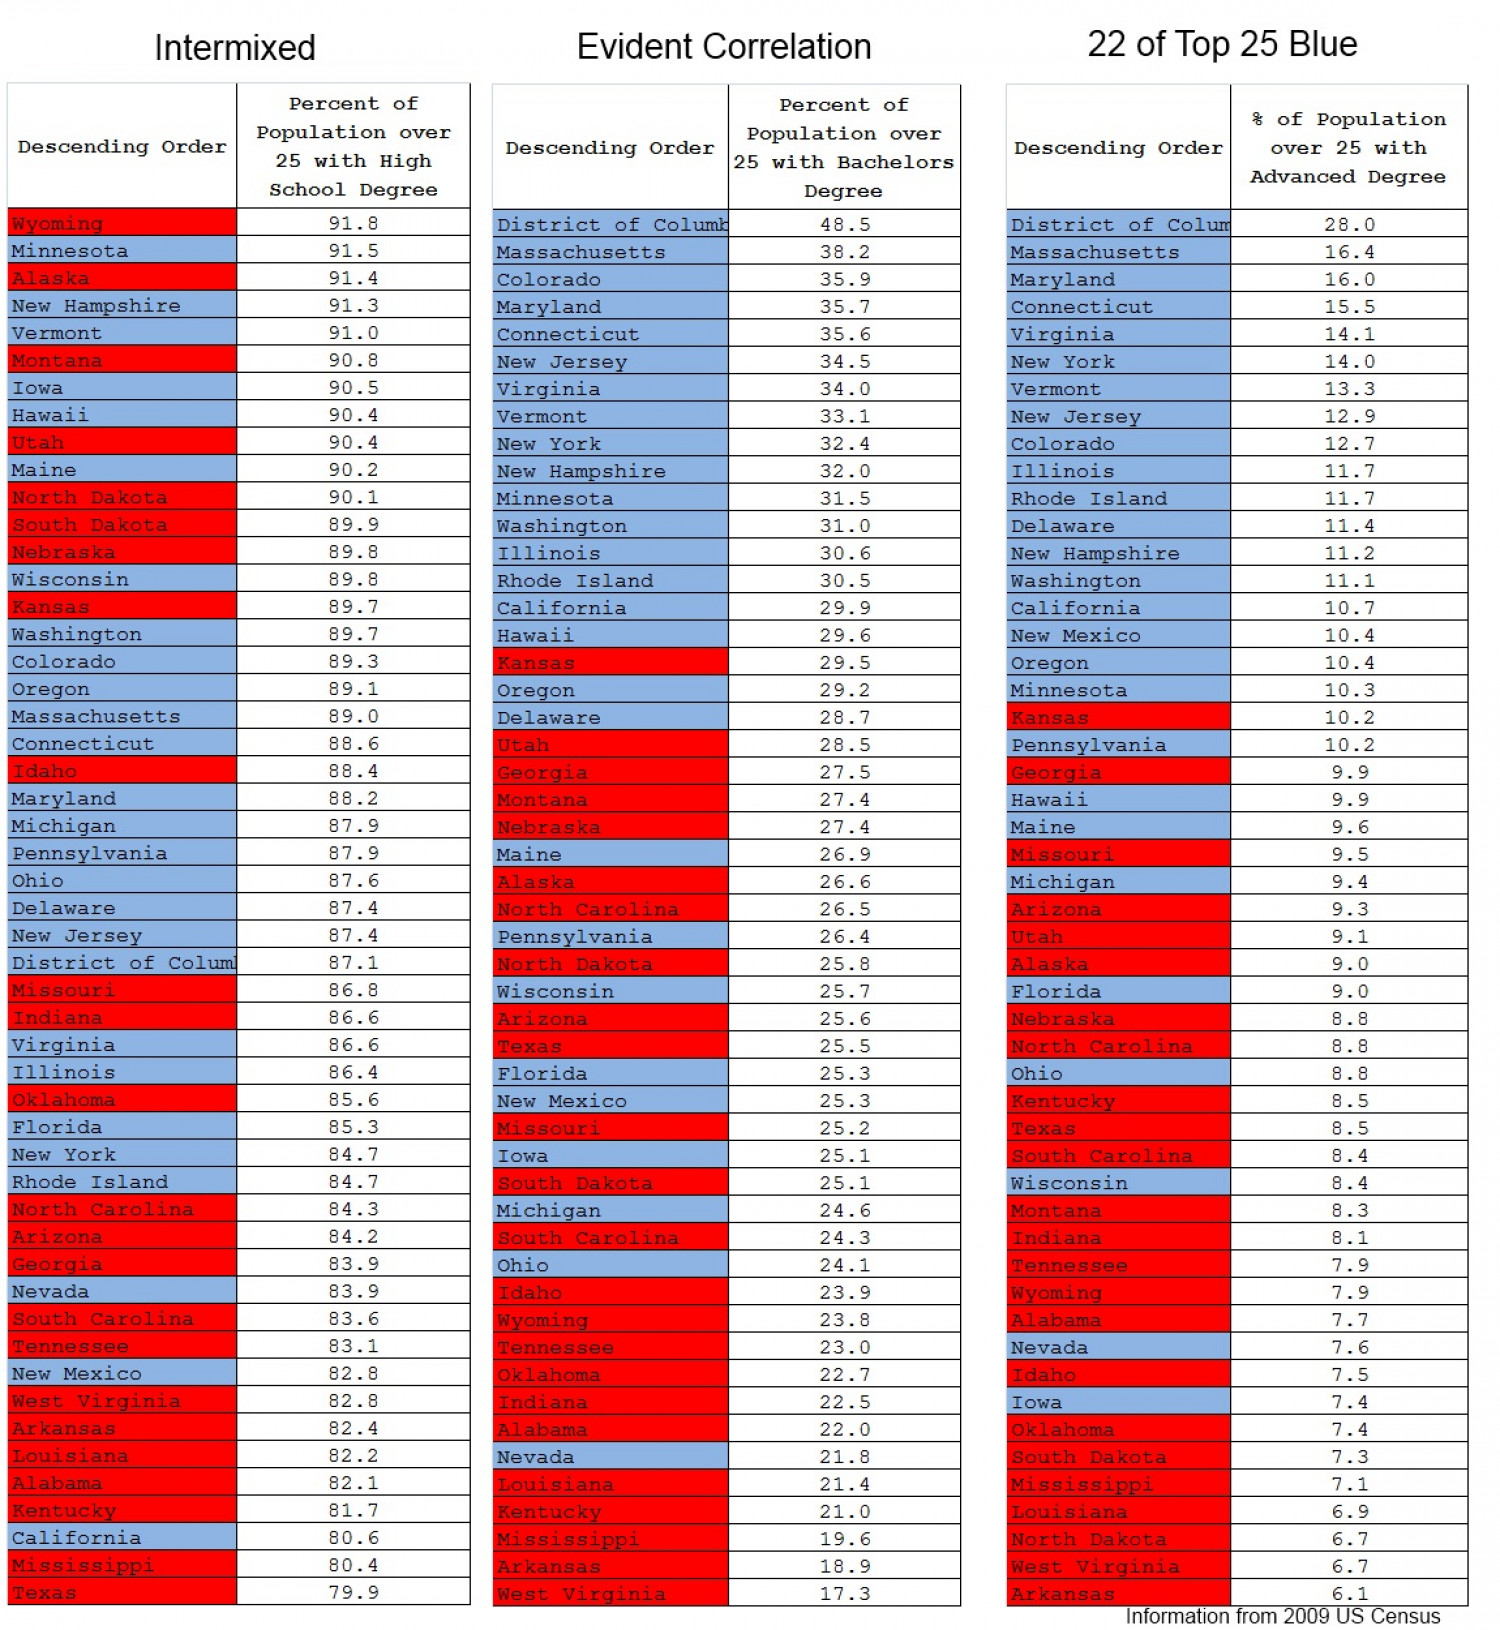
2012 Election Results vs Education Level
Intermixed Evident Correlation 22 of Top 25 Blue Percent of Percent of % of Population Population over 25 with Bachelors Population over Descending Order Descending Order Descending Order over 25 with 25 with High Advanced Degree School Degree Degree Wyoming 91.8 District of Columb 48.5 District of Colum 28.0 Minnesota 91.5 Massachusetts 38.2 Massachusetts 16.4 Alaska 91.4 Colorado 35.9 Maryland 16.0 New Hampshire 91.3 Maryland 35.7 Connecticut 15.5 Vermont 91.0 Connecticut 35.6 Virginia 14.1 Montana 90.8 New Jersey 34.5 New York 14.0 virginia 13.3 Iowa 90.5 34.0 Vermont Hawaii 90.4 Vermont 33.1 New Jersey 12.9 Utah 90.4 New York 32.4 Colorado 12.7 Maine 90.2 New Hampshire 32.0 Illinois 11.7 North Dakota 90.1 Minnesota 31.5 Rhode Island 11.7 South Dakota 89.9 Washington Illinois 31.0 Delaware 11.4 New Hampshire Washington Nebraska 89.8 30.6 11.2 Wisconsin 89.8 Rhode Island 30.5 11.1 Kansas 89.7 California 29.9 California 10.7 Washington 89.7 Hawaii 29.6 New Mexico 10.4 Colorado 89.3 Kansas 29.5 Oregon 10.4 Oregon 89.1 Oregon 29.2 Minnesota 10.3 Massachusetts 89.0 Delaware 28.7 Kansas 10.2 Connecticut 88.6 Utah 28.5 Pennsylvania 10.2 Idaho 88.4 Georgia 27.5 Georgia 9.9 Maryland Michigan 88.2 Montana 27.4 Hawaii 9.9 87.9 Nebraska 27.4 Maine 9.6 Pennsylvania Ohio 87.9 Maine 26.9 Missouri 9.5 87.6 Alaska 26.6 Michigan 9.4 Delaware 87.4 North Carolina 26.5 Arizona 9.3 New Jersey District of Columl 87.4 Pennsylvania 26.4 Utah 9.1 87.1 North Dakota 25.8 Alaska 9.0 Missouri 86.8 Wisconsin 25.7 Florida 9.0 Indiana 86.6 Arizona 25.6 Nebraska 8.8 virginia 86.6 25.5 North Carolina 8.8 Texas Illinois 86.4 Florida 25.3 Ohio 8.8 Oklahoma 85.6 New Mexico 25.3 Kentucky 8.5 Florida 85.3 Missouri 25.2 Texas 8.5 New York 84.7 Iowa 25.1 South Carolina 8.4 Rhode Island 84.7 South Dakota 25.1 Wisconsin 8.4 North Carolina 84.3 Michigan 24.6 Montana 8.3 Arizona 84.2 South Carolina 24.3 Indiana 8.1 Georgia 83.9 Ohio 24.1 7.9 Tennessee Nevada 83.9 Idaho 23.9 Wyoming 7.9 South Carolina 83.6 Wyoming 23.8 Alabama 7.7 Tennessee 83.1 Tennessee 23.0 Nevada 7.6 New Mexico 82.8 Oklahoma 22.7 Idaho 7.5 West Virginia 82.8 Indiana 22.5 Iowa 7.4 Arkansas 82.4 Alabama 22.0 Oklahoma 7.4 Louisiana 82.2 Nevada 21.8 South Dakota 7.3 Alabama 82.1 Louisiana 21.4 Mississippi 7.1 Kentucky 81.7 Louisiana Kentucky Mississippi 21.0 6.9 California 80.6 19.6 North Dakota 6.7 Mississippi West Virginia 80.4 Arkansas 18.9 6.7 Texas 79.9 West Virginia 17.3 Arkansas 6.1 Information from 2009 US Census
2012 Election Results vs Education Level
Source
http://www.r..._vs_state/Category
PoliticsGet a Quote
You may also like...


